PDF下载 ( 799 KB)

血清肌酐与胱抑素C比值(CCR)对HBV相关慢加急性肝衰竭预后的评估价值
DOI: 10.12449/JCH240208
Value of serum creatinine-to-cystatin C ratio in assessing the prognosis of hepatitis B virus-related acute-on-chronic liver failure
-
摘要:
目的 探讨血清肌酐与胱抑素C比值(CCR)评估HBV相关慢加急性肝衰竭(HBV-ACLF)预后的临床价值。 方法 回顾性分析2021年1月—2022年11月苏州大学附属第一医院感染病科住院治疗的130例HBV-ACLF患者(治疗组)临床资料,根据治疗结局分为生存组(n=87)和死亡组(n=43);根据是否合并感染,分为感染组(n=37)和非感染组(n=93)。以同期30例健康体检者作为对照组。收集入院当天血常规指标,包括白细胞、血小板、中性粒细胞和淋巴细胞计数;观察入院当天、住院第5天、第10天、第15天血清肌酐、胱抑素C、血清Alb、PT,计算CCR、中性粒细胞与淋巴细胞比值(NLR)、血小板与淋巴细胞比值(PLR)、营养指数(PNI)、CCR5(入院后第5天CCR)、ΔCCR5(入院后第5天CCR-入院当天CCR)、CCR10(入院后第10天CCR)、ΔCCR10(入院后第10天CCR-入院后第5天CCR)、CCR15(入院后第15天CCR)、ΔCCR15(入院后第15天CCR-入院后第10天CCR),比较生存组和死亡组、感染组与非感染组上述指标的差异。计量资料两组间比较采用Mann-Whitney U检验;多组间比较采用Kruskal-Wallis H检验。单因素和多因素Logistic回归分析探讨影响疾病预后的因素;受试者工作特征曲线(ROC曲线)评估CCR对HBV-ACLF死亡事件的预测价值,ROC曲线下面积(AUC)比较采用DeLong检验。 结果 治疗组基线CCR、NLR、PNI、PT和Alb与健康对照组比较,差异均有统计学意义(P值均<0.001)。生存组与死亡组患者入院当天CCR、NLR、PT比较,差异均有统计学意义(P值均<0.05)。在130例HBV-ACLF患者中,有25例处于前期,48例处于早期,32例处于中期,25例处于晚期。各分期HBV-ACLF患者基线CCR、PLR及PT比较,差异均有统计学意义(P值均<0.05)。感染组与非感染组患者基线ΔCCR5、NLR比较,差异均有统计学意义(P值均<0.05)。患者入院第5天、第10天、第15天生存组与死亡组ΔCCR5、CCR10、CCR15比较,差异均有统计学意义(P值均<0.05)。多因素Logistic回归分析发现ΔCCR5(OR=1.175,95%CI:1.098~1.256,P<0.001)、NLR(OR=0.921,95%CI:0.880~0.964,P<0.001)和PT(OR=0.921,95%CI:0.873~0.973,P=0.003)是HBV-ACLF患者预后的独立影响因素。ΔCCR5的AUC为0.774,敏感度为0.687,特异度为0.757;ΔCCR5+PT+NLR联合的AUC为0.824,高于ΔCCR5、NLR、PT单独预测时的AUC(P值均<0.05)。 结论 ΔCCR5、NLR、PT可反映HBV-ACLF患者的病情及预后,是HBV-ACLF患者死亡事件的独立预测指标,ΔCCR5+PT+NLR联合时预测效能最佳。 -
关键词:
- 乙型肝炎病毒 /
- 慢加急性肝功能衰竭 /
- 肌酸酐 /
- 半胱氨酸蛋白酶抑制物C /
- 预后
Abstract:Objective To investigate the clinical value of serum creatinine-to-cystatin C ratio (CCR) in evaluating the prognosis of hepatitis B virus-related acute-on-chronic liver failure (HBV-ACLF). Methods A retrospective analysis was performed for the clinical data of 130 patients with HBV-ACLF (treatment group) who were hospitalized in Department of Infectious Diseases, The First Affiliated Hospital of Soochow University, from January 2021 to November 2022. According to the treatment outcome, they were divided into survival group with 87 patients and death group with 43 patients; according to the presence or absence of infection, they were divided into infection group with 37 patients and non-infection group with 93 patients. A total of 30 individuals who underwent physical examination during the same period of time were enrolled as control group. Routine blood test results were collected on the day of admission, including white blood cell count, platelet count, neutrophil count, and lymphocyte count; serum creatinine, cystatin C, serum albumin (Alb), and prothrombin time (PT) were observed on the day of admission and on days 5, 10, and 15 of hospitalization, and related indicators were calculated, including CCR, neutrophil-to-lymphocyte ratio (NLR), platelet-to-lymphocyte ratio (PLR), prognostic nutritional index (PNI), CCR5 (CCR on day 5 after admission), ΔCCR5 (CCR on day 5 after admission minus CCR on the day of admission), CCR10 (CCR on day 10 after admission), ΔCCR10 (CCR on day 10 after admission minus CCR on day 5 after admission), CCR15 (CCR on day 15 after admission), and ΔCCR15 (CCR on day 15 after admission minus CCR on day 10 after admission). The above indicators were compared between the survival group and the death group and between the infection group and the non-infection group. The Mann-Whitney U test was used for comparison of continuous data between two groups, and the Kruskal-Wallis H test was used for comparison between multiple groups. The univariate and multivariate logistic regression analyses were used to investigate the influencing factors for disease prognosis; the receiver operating characteristic (ROC) curve was used to assess the value of CCR in predicting HBV-ACLF death events, and the DeLong test was used for comparison of the area under the ROC curve (AUC). Results There were significant differences in CCR, NLR, PNI, PT, and Alb at baseline between the treatment group and the healthy control group (all P<0.001), and there were significant differences in CCR, NLR, and PT between the survival group and the death group on the day of admission (all P<0.05). Among the 130 patients with HBV-ACLF, there were 25 in the precancerous stage, 48 in the early stage, 32 in the intermediate stage, and 25 in the advanced stage, and there were significant differences in baseline CCR, PLR, and PT between the patients in different stages of HBV-ACLF (all P<0.05). There were significant differences in ΔCCR5 and NLR between the infection group and the non-infection group (P<0.05), and there were significant differences in ΔCCR5, CCR10, and CCR15 between the survival group and the death group (all P<0.05). The multivariate logistic regression analysis showed that ΔCCR5 (odds ratio [OR]=1.175, 95% confidence interval [CI]: 1.098 — 1.256, P<0.001), NLR (OR=0.921, 95%CI: 0.880 — 0.964, P<0.001), and PT (OR=0.921, 95%CI: 0.873 — 0.973, P=0.003) were independent influencing factors for the prognosis of HBV-ACLF patients. ΔCCR5 had an AUC of 0.774, a sensitivity of 0.687, and a specificity of 0.757, and the AUC of ΔCCR5+PT+NLR was 0.824, which was significantly higher than the AUC of ΔCCR5, NLR, or PT alone (all P<0.05). Conclusion ΔCCR5, NLR, and PT can reflect the condition and prognosis of patients with HBV-ACLF and are independent predictive indicators for death events in patients with HBV-ACLF. The combination ofΔCCR5, PT, and NLR has the best predictive efficiency. -
Key words:
- Hepatitis B Virus /
- Acute-On-Chronic Liver Failure /
- Creatinine /
- Cystatin C /
- Prognosis
-
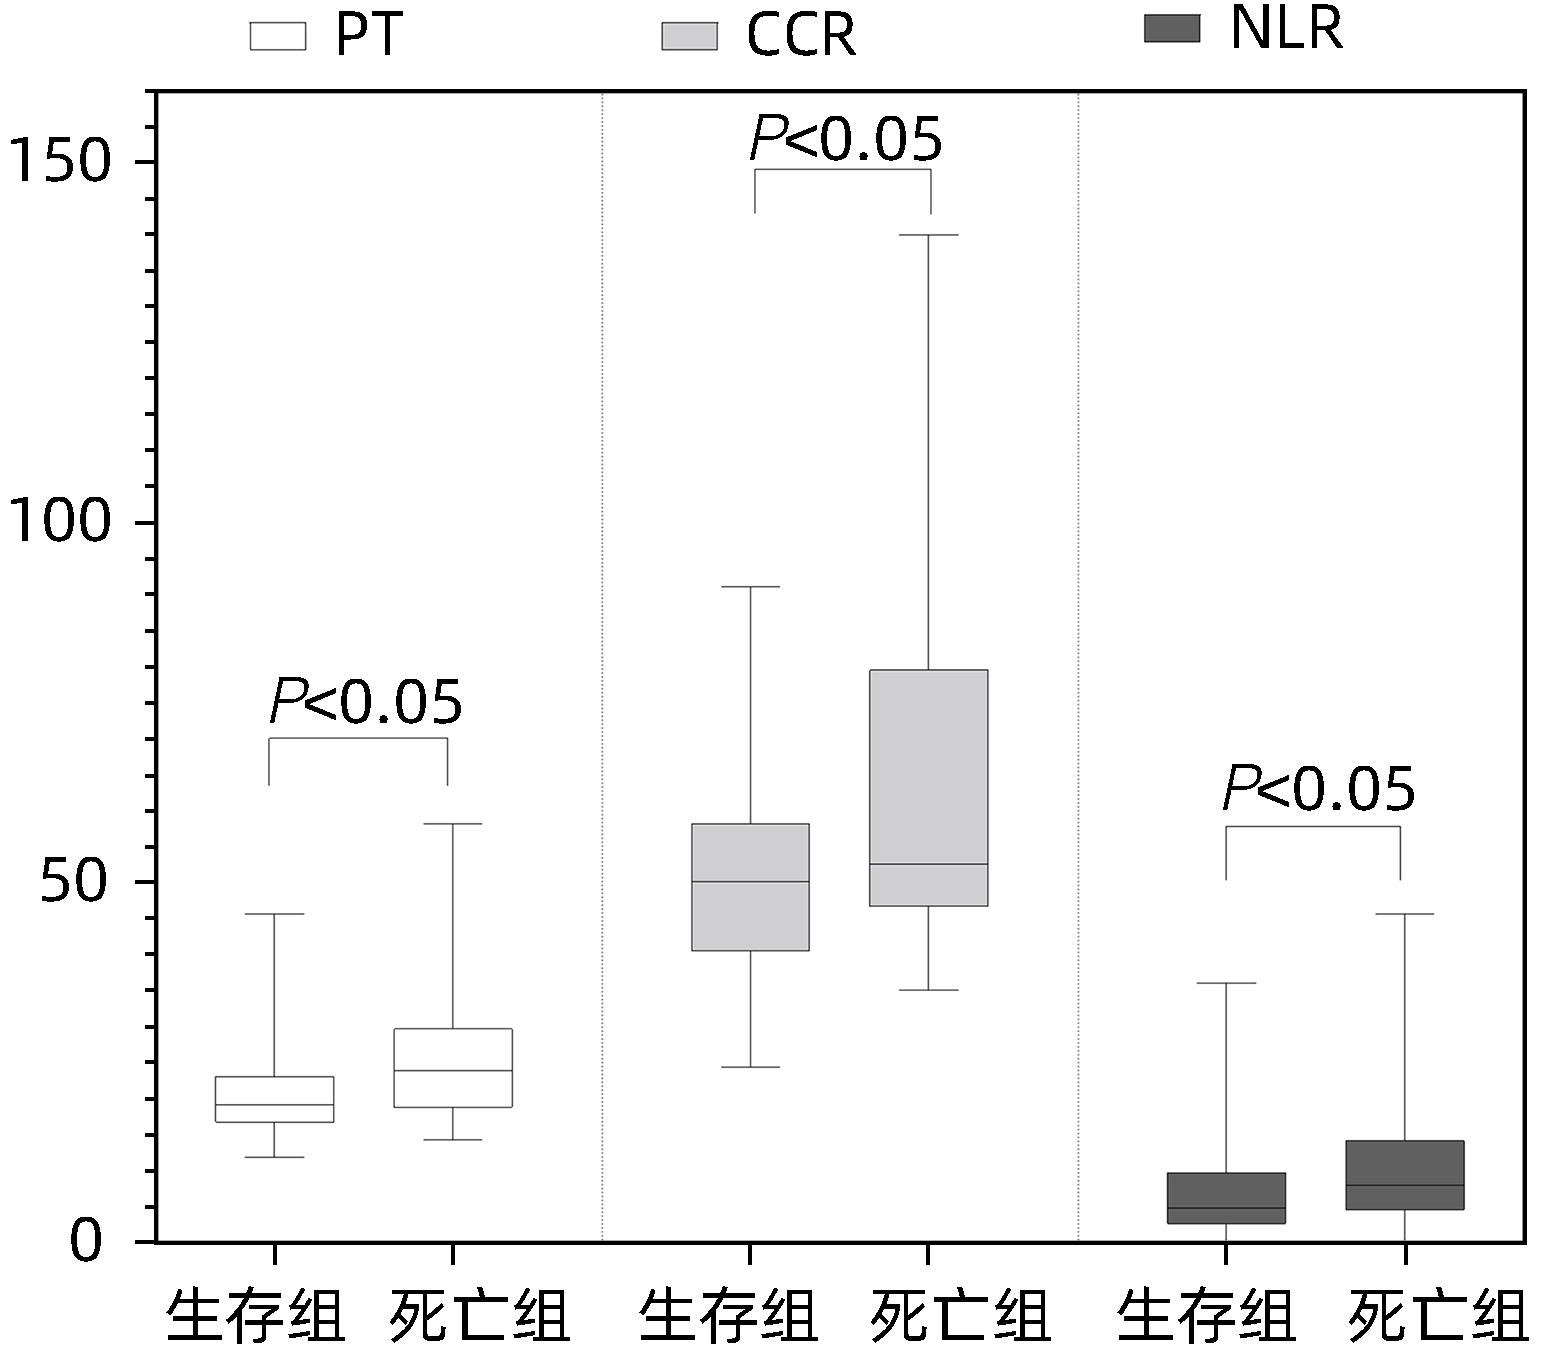
图 1 生存组与死亡组患者基线指标比较
Figure 1. Comparison of baseline indexes between survival group and death group
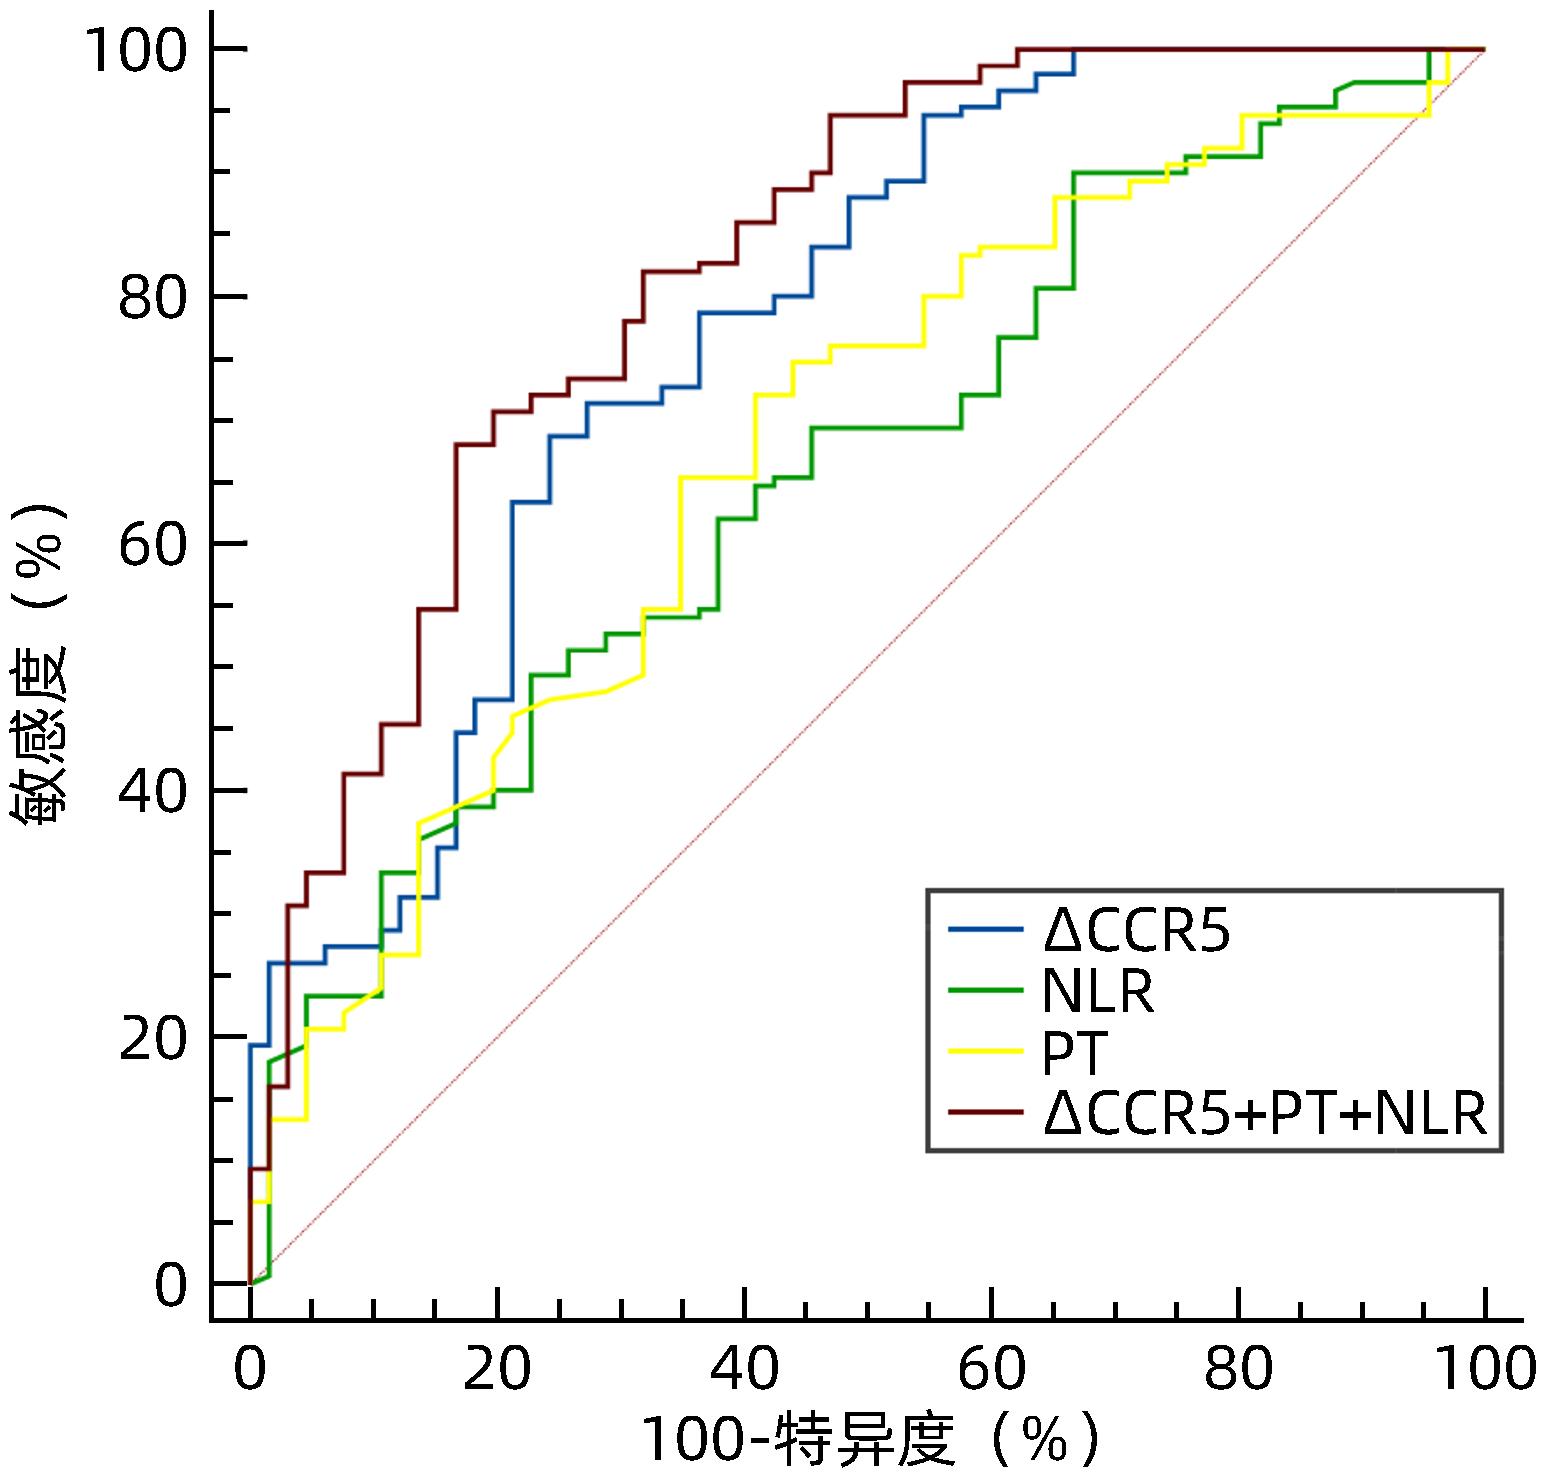
图 2 ΔCCR5、PT、NLR、ΔCCR5+PT+NLR预测HBV-ACLF患者死亡事件的ROC曲线
Figure 2. ΔCCR5, PT, NLR, ΔCCR5+PT+NLR predict the ROC curve of death events in patients with HBV-ACLF
表 1 治疗组与健康对照组基线指标比较
Table 1. Comparison of baseline indexes between the treatment group and the healthy control group
指标 健康对照组(n=30) 治疗组(n=130) Z值 P值 男/女(例) 15/15 78/52 χ2=-1.233 0.190 年龄(岁) 52(47~76) 53(42~66) Z=-0.638 0.524 CCR(μmol/mg) 74.67(64.54~83.18) 51.22(43.35~62.33) Z=-6.378 <0.001 NLR 1.88(1.35~2.24) 5.81(2.89~11.11) Z=-6.745 <0.001 PLR 109.00(88.54~123.89) 96.77(57.38~146.99) Z=-1.437 0.151 PNI 51.80(49.34~54.80) 34.50(30.70~38.10) Z=-8.418 <0.001 PT(s) 10.90(10.38~11.75) 19.70(17.60~25.80) Z=-8.881 <0.001 Alb(g/L) 42.90(41.08~44.30) 29.10(26.53~32.60) Z=-8.746 <0.001  下载: 导出CSV
表 2 HBV-ACLF患者不同分期基线指标比较
Table 2. Baseline markers of HBV-ACLF at different stages were compared
指标 前期(n=25) 早期(n=48) 中期(n=32) 晚期(n=25) H值 P值 CCR(μmol/mg) 43.85(38.01~53.55) 53.01(43.18~64) 51.69(44.95~60.57) 56.84(46.43~80.44) 19.816 <0.001 NLR 5.70(2.38~10.69) 6.58(3.43~12.38) 5.55(2.80~10.45) 7.64(2.77~11.25) 2.070 0.558 PLR 77.38(52.27~140.63) 106.96(65.79~188.73) 69.44(50.18~143.86) 78.21(54.02~120.69) 13.698 0.003 PNI 32.65(30.60~37.25) 34.55(30.50~38.85) 33.90(29.35~37.65) 36.25(32.35~39.55) 5.949 0.114 PT(s) 17.60(16.25~19.05) 18.20(16.20~19.50) 24.00(22.50~26.05) 33.10(30.30~41.00) 187.731 <0.001 Alb(g/L) 28.70(26.20~30.50) 28.80(26.40~32.70) 29.10(26.10~32.90) 29.80(28.00~33.20) 3.285 0.350
下载: 导出CSV
表 3 非感染组与感染组基线指标比较
Table 3. Comparison of baseline indexes between infected group and non-infected group
指标 感染组(n=37) 非感染组(n=93) Z值 P值 CCR(μmol/mg) 54.17(40.49~66.08) 50.74(43.78~62.33) -1.098 0.272 NLR 12.38(7.64~16.29) 4.65(2.70~7.98) -6.363 <0.001 PLR 107.53(57.86~168.42) 93.18(60.34~145.16) -0.414 0.679 PNI 35.65(31.20~38.65) 34.20(30.50~37.80) -0.630 0.529 PT(s) 18.60(16.60~24.75) 20.30(17.50~25.10) -0.623 0.533 Alb(g/L) 28.70(25.25~32.40) 29.10(26.70~32.30) -0.416 0.678 ΔCCR5(μmol/mg) -13.94(-22.19~-5.48) -9.41(-13.40~-5.04) -2.675 0.007
下载: 导出CSV
表 4 死亡组与生存组患者入院第5天、第10天、第15天CCR动态比较
Table 4. Dynamic comparison of CCR in death group and survival group at 5、10 and 15 days after admission
指标 死亡组(n=43) 生存组(n=87) Z值 P值 CCR5(μmol/mg) 39.70(32.32~46.86) 40.80(37.00~49.37) -0.360 0.719 ΔCCR5(μmol/mg) -18.43(-70.19~-13.40) -9.41(-11.25~-3.49) -5.380 <0.001 CCR10(μmol/mg) 40.00(1.82~44.62) 39.32(33.65~49.04) -2.410 0.016 ΔCCR10(μmol/mg) -4.89(-32.44~-0.69) -3.44(-5.56~1.47) -1.674 0.094 CCR15(μmol/mg) 27.84(24.69~34.43) 37.60(31.64~46.86) -3.480 <0.001 ΔCCR15(μmol/mg) -7.55(-12.16~22.87) -2.64(-7.49~2.09) -1.323 0.186
下载: 导出CSV
表 5 基线指标单因素及多因素Logistic回归分析
Table 5. The baseline indexes were analyzed by binary single factor and multivariate Logistic regression
指标 单因素分析 多因素分析 OR(95%CI) P值 OR(95%CI) P值 ΔCCR5(μmol/mg) 1.163(1.101~1.228) <0.001 1.175(1.098~1.256) <0.001 PT(s) 0.912(0.876~0.950) <0.001 0.921(0.873~0.973) 0.003 NLR 0.948(0.917~0.980) 0.001 0.921(0.880~0.964) <0.001 CCR(μmol/mg) 0.959(0.943~0.976) <0.001 1.006(0.976~1.036) 0.713 PLR 1.003(0.999~1.007) 0.191 PNI 0.997(0.976~1.018) 0.780 Alb(g/L) 0.993(0.937~1.051) 0.798
下载: 导出CSV
表 6 ΔCCR5、PT、NLR、ΔCCR5+PT+NLR预测HBV-ACLF患者死亡事件效能分析
Table 6. Efficacy analysis of ΔCCR5, PT, NLR, ΔCCR5+PT+NLR in predicting death events in patients with HBV-ACLF
变量 AUC 95%CI P值 最佳临界值 敏感度 特异度 约登指数 PT(s) 0.704 0.643~0.761 <0.001 21.500 0.710 0.650 0.360 NLR 0.645 0.581~0.705 <0.001 4.610 0.481 0.762 0.244 ∆CCR5(μmol/mg) 0.774 0.712~0.828 <0.001 -10.150 0.687 0.757 0.444 ∆CCR5+PT+NLR 0.824 0.767~0.873 <0.001 0.700 0.680 0.833 0.513
下载: 导出CSV
-
[1] Chinese Society of Hepatology, Chinese Medical Association; Chinese Society of Gastroenterology, Chinese Medical Association. Clinical guidelines on nutrition in end-stage liver disease[J]. J Clin Hepatol, 2019, 35( 6): 1222- 1230. DOI: 10.3969/j.issn.1001-5256.2019.06.010.中华医学会肝病学分会, 中华医学会消化病学分会. 终末期肝病临床营养指南[J]. 临床肝胆病杂志, 2019, 35( 6): 1222- 1230. DOI: 10.3969/j.issn.1001-5256.2019.06.010. [2] MANGANA DEL RIO T, SACLEUX SC, VIONNET J, et al. Body composition and short-term mortality in patients critically ill with acute-on-chronic liver failure[J]. JHEP Rep, 2023, 5( 8): 100758. DOI: 10.1016/j.jhepr.2023.100758. [3] NISHIKAWA H, SHIRAKI M, HIRAMATSU A, et al. Japan Society of Hepatology guidelines for sarcopenia in liver disease(1st edition): Recommendation from the working group for creation of sarcopenia assessment criteria[J]. Hepatol Res, 2016, 46( 10): 951- 963. DOI: 10.1111/hepr.12774. [4] PENG H, ZHANG Q, LUO L, et al. A prognostic model of acute-on-chronic liver failure based on sarcopenia[J]. Hepatol Int, 2022, 16( 4): 964- 972. DOI: 10.1007/s12072-022-10363-2. [5] SANCHEZ-RODRIGUEZ D, MARCO E, CRUZ-JENTOFT AJ. Defining sarcopenia: Some caveats and challenges[J]. Curr Opin Clin Nutr Metab Care, 2020, 23( 2): 127- 132. DOI: 10.1097/MCO.0000000000000621. [6] SAYER AA, CRUZ-JENTOFT A. Sarcopenia definition, diagnosis and treatment: Consensus is growing[J]. Age Ageing, 2022, 51( 10): afac220. DOI: 10.1093/ageing/afac220. [7] KASHANI KB, FRAZEE EN, KUKRÁLOVÁ L, et al. Evaluating muscle mass by using markers of kidney function: Development of the sarcopenia index[J]. Crit Care Med, 2017, 45( 1): e23- e29. DOI: 10.1097/CCM.0000000000002013. [8] WANG S, XIE L, XU J, et al. Predictive value of serum creatinine/cystatin C in neurocritically ill patients[J]. Brain Behav, 2019, 9( 12): e01462. DOI: 10.1002/brb3.1462. [9] JUNG CY, KIM HW, HAN SH, et al. Creatinine-cystatin C ratio and mortality in cancer patients: A retrospective cohort study[J]. J Cachexia Sarcopenia Muscle, 2022, 13( 4): 2064- 2072. DOI: 10.1002/jcsm.13006. [10] Liver Failure and Artificial Liver Group, Chinese Society of Infectious Diseases, Chinese Medical Association; Severe Liver Disease and Artificial Liver Group, Chinese Society of Hepatology, Chinese Medical Association. Guideline for diagnosis and treatment of liver failure(2018)[J]. J Clin Hepatol, 2019, 35( 1): 38- 44. DOI: 10.3969/j.issn.1001-5256.2019.01.007.中华医学会感染病学分会肝衰竭与人工肝学组, 中华医学会肝病学分会重型肝病与人工肝学组. 肝衰竭诊治指南(2018年版)[J]. 临床肝胆病杂志, 2019, 35( 1): 38- 44. DOI: 10.3969/j.issn.1001-5256.2019.01.007. [11] LI JQ, LIANG X, YOU SL, et al. Development and validation of a new prognostic score for hepatitis B virus-related acute-on-chronic liver failure[J]. J Hepatol, 2021, 75( 5): 1104- 1115. DOI: 10.1016/j.jhep.2021.05.026. [12] GAO FY, ZHANG QQ, LIU Y, et al. Nomogram prediction of individual prognosis of patients with acute-on-chronic hepatitis B liver failure[J]. Dig Liver Dis, 2019, 51( 3): 425- 433. DOI: 10.1016/j.dld.2018.08.023. [13] SUN ZY, LIU XL, WU DX, et al. Circulating proteomic panels for diagnosis and risk stratification of acute-on-chronic liver failure in patients with viral hepatitis B[J]. Theranostics, 2019, 9( 4): 1200- 1214. DOI: 10.7150/thno.31991. [14] BEER L, BASTATI N, BA-SSALAMAH A, et al. MRI-defined sarcopenia predicts mortality in patients with chronic liver disease[J]. Liver Int, 2020, 40( 11): 2797- 2807. DOI: 10.1111/liv.14648. [15] JIN L, LI X. MRI-defined sarcopenia predicts mortality in patients with chronic liver disease[J]. Liver Int, 2021, 41( 1): 223. DOI: 10.1111/liv.14691. [16] WANG T, ZHANG YG, LI QQ, et al. Evaluation value of area index of the third lumbar psoas major muscle in nutritional status and prognosis of patients with cirrhosis[J]. Clin J Med Offic, 2022, 50( 7): 729- 732. DOI: 10.16680/j.1671-3826.2022.07.18.王然, 张永国, 李谦谦, 等. 第三腰椎腰大肌面积指数对肝硬化患者营养状态及预后评估价值[J]. 临床军医杂志, 2022, 50( 7): 729- 732. DOI: 10.16680/j.1671-3826.2022.07.18. [17] Society of Infectious Diseases, Chinese Medical Association. Expert consensus on diagnosis and treatment of end-stage liver disease complicated with infections(2021 version)[J]. J Clin Hepatol, 2022, 38( 2): 304- 310. DOI: 10.3969/j.issn.1001-5256.2022.02.010.中华医学会感染病学分会. 终末期肝病合并感染诊治专家共识(2021年版)[J]. 临床肝胆病杂志, 2022, 38( 2): 304- 310. DOI: 10.3969/j.issn.1001-5256.2022.02.010. [18] WANG XB, ZHANG Q, GAO FY. Prediction of acute-on-chronic liver failure and integrated traditional Chinese and Western medicine therapy[J]. J Clin Hepatol, 2020, 36( 1): 19- 25. DOI: 10.3969/j.issn.1001-5256.2020.01.003.王宪波, 张群, 高方媛. 慢加急性肝衰竭的预后评估及中西医结合治疗[J]. 临床肝胆病杂志, 2020, 36( 1): 19- 25. DOI: 10.3969/j.issn.1001-5256.2020.01.003. [19] HAINES RW, ZOLFAGHARI P, WAN Y, et al. Elevated urea-to-creatinine ratio provides a biochemical signature of muscle catabolism and persistent critical illness after major trauma[J]. Intensive care medicine, 2019, 45( 12): 1718- 1731. DOI: 10.1007/s00134-019-05760-5. [20] PAGE A, FLOWER L, PROWLE J, et al. Novel methods to identify and measure catabolism[J]. Curr Opin Crit Care, 2021, 27( 4): 361- 366. DOI: 10.1097/MCC.0000000000000842. [21] VERHAMME FM, FREEMAN CM, BRUSSELLE GG, et al. GDF-15 in pulmonary and critical care medicine[J]. Am J Respir Cell Mol Biol, 2019, 60( 6): 621- 628. DOI: 10.1165/rcmb.2018-0379TR. [22] LEE ES, KIM SH, KIM HJ, et al. Growth differentiation factor 15 predicts chronic liver disease severity[J]. Gut Liver, 2017, 11( 2): 276- 282. DOI: 10.5009/gnl16049. [23] ZHANG IW, CURTO A, LÓPEZ-VICARIO C, et al. Mitochondrial dysfunction governs immunometabolism in leukocytes of patients with acute-on-chronic liver failure[J]. J Hepatol, 2022, 76( 1): 93- 106. DOI: 10.1016/j.jhep.2021.08.009. [24] WEINERT LS, CAMARGO EG, SOARES AA, et al. Glomerular filtration rate estimation: Performance of serum cystatin C-based prediction equations[J]. Clin Chem Lab Med, 2011, 49( 11): 1761- 1771. DOI: 10.1515/CCLM.2011.670. [25] EINHORN D, MENDE CW. Combining creatinine-based EGFR with cystatin C-based EGFR to better assess renal function in patients with diabetes and chronic kidney disease 3a: Implications for drug selection and dosage in type 2 diabetes[J]. Endocr Pract, 2015, 21( 11): 1301- 1302. DOI: 10.4158/EP15821.ED. [26] CHEN XY, SHEN YJ, HOU LS, et al. Sarcopenia index based on serum creatinine and cystatin C predicts the risk of postoperative complications following hip fracture surgery in older adults[J]. BMC Geriatr, 2021, 21( 1): 541. DOI: 10.1186/s12877-021-02522-1. [27] ULMANN G, KAÏ J, DURAND JP, et al. Creatinine-to-cystatin C ratio and bioelectrical impedance analysis for the assessement of low lean body mass in cancer patients: Comparison to L3-computed tomography scan[J]. Nutrition, 2021, 81: 110895. DOI: 10.1016/j.nut.2020.110895. [28] ZHENG C, WANG E, LI JS, et al. Serum creatinine/cystatin C ratio as a screening tool for sarcopenia and prognostic indicator for patients with esophageal cancer[J]. BMC Geriatr, 2022, 22( 1): 207. DOI: 10.1186/s12877-022-02925-8. [29] SUN J, YANG H, CAI WT, et al. Serum creatinine/cystatin C ratio as a surrogate marker for sarcopenia in patients with gastric cancer[J]. BMC Gastroenterol, 2022, 22( 1): 26. DOI: 10.1186/s12876-022-02093-4. -

 本文二维码
本文二维码
计量
- 文章访问数: 1096
- HTML全文浏览量: 431
- PDF下载量: 95
- 被引次数: 0