PDF下载 ( 3265 KB)

基于CT图像的腹部肌肉内部分层分析对原位肝移植术后并发症的预测价值
DOI: 10.12449/JCH250218
Value of internal stratification analysis of abdominal wall muscles in predicting complications after orthotopic liver transplantation
-
摘要:
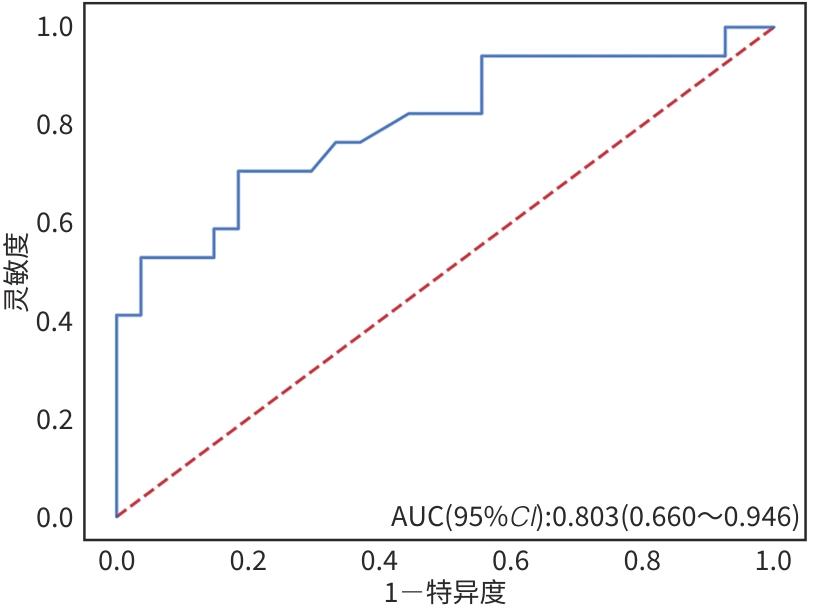
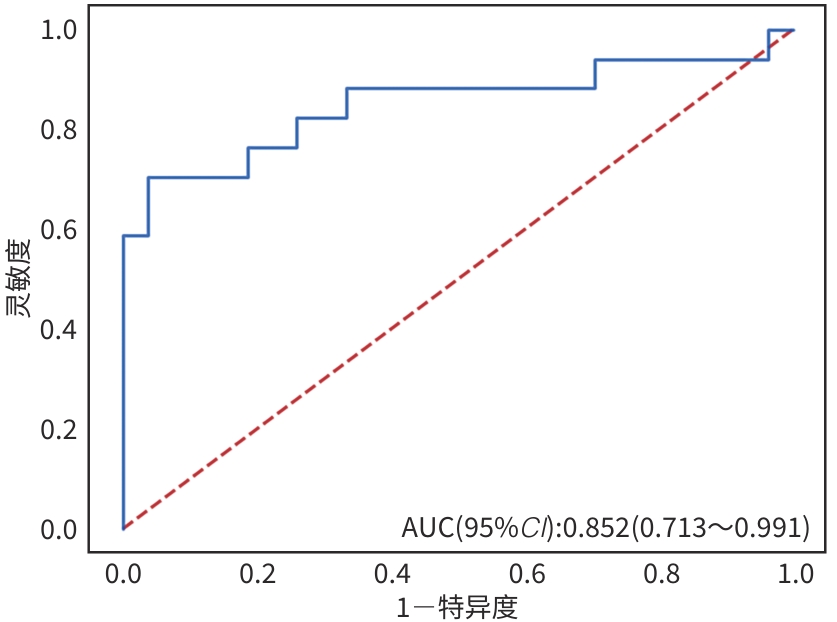
目的 本文旨在肌肉脂肪浸润的基础上,利用分层分析的方法将肌肉内部按照不同的密度范围划分成不同的亚分区,进一步研究肌肉密度改变对原位肝移植术(OLT)后并发症(Clavien-Dindo≥Ⅲ)的影响。 方法 回顾性分析2013年5月—2020年9月于吉林大学第一医院行OLT的145例患者,以患者腰3椎体水平最大层面的CT平扫图像作为原始数据,利用Neusoft Fatanalysis软件对图像进行相关肌肉参数的测量。符合正态分布的计量资料组间比较采用成组t检验;不符合正态分布的组间比较采用Mann-Whitney U秩和检验。计数资料组间比较采用χ2或Fisher检验。利用RIAS软件进行临床特征提取及分析建模,分别建立逻辑回归(LR)、支持向量机(SVM)、随机森林(RFC)3种机器学习模型,并绘制不同模型的受试者操作特征曲线(ROC曲线)、校正曲线、决策分析曲线,计算ROC曲线下面积(AUC)、灵敏度、特异度、精确率、F1分数、准确率。 结果 采用肌肉分层分析前的7种临床特征建立LR-C、SVM-C、RFC-C 3种机器学习模型,其中RFC-C模型测试集的AUC值为0.803、灵敏度0.588,特异度0.778。采用肌肉分层分析后的16种临床特征建立的LR-CS、SVM-CS、RFC-CS模型中,LR-CS及SVM-CS模型测试集的AUC值较高,均为0.852,灵敏度分别为0.765、0.706,特异度分别为0.889、0.926,通过对比肌肉分层分析前后各模型测试集的AUC、灵敏度、特异度、精确率、F1分数、准确率后发现,肌肉分层分析后预测模型的参数均有所提升。通过对比各预测模型的决策分析曲线和校正曲线,发现LR-CS及SVM-CS模型对于预测OLT患者术后并发症(Clavien-Dindo≥Ⅲ)具有良好效能。 结论 在肌肉脂肪浸润的基础上,利用分层分析的方法将肌肉内部按照不同的密度划分成不同子区,对于OLT患者术后并发症有一定预测价值。 Abstract:Objective To divide the muscle into different subzones according to different density ranges using the stratified analysis on the basis of myosteatosis, and to investigate the effect of muscle density changes on complications (Clavien-Dindo grade ≥Ⅲ) after orthotopic liver transplantation (OLT). Methods A retrospective analysis was performed for the medical records of 145 patients who underwent OLT in The First Hospital of Jilin University from May 2013 to September 2020, and with the plain CT scan images of the largest level of lumbar 3 vertebrae of each patient as the original data, Neusoft Fatanalysis software was used to measure related muscle parameters. The independent-samples t test was used for comparison of normally distributed continuous data between two groups, and the Mann-Whitney U test was used for comparison of non-normally distributed continuous data between two groups. The chi-square test or Fisher test was for comparison of categorical data between two groups. RIAS software was used to extract clinical features and perform analysis and modeling, and three machine learning models of logistic regression (LR), support vector machine (SVM), and random forest (RFC) were constructed. The receiver operating characteristic (ROC) curve, the calibration curve, and the decision curve were plotted for each model to calculate the area under the ROC curve (AUC), sensitivity, specificity, precision, F1 score, and accuracy. Results The three machine learning models of LR-C, SVM-C, and RFC-C were established based on the 7 clinical features before muscle stratification analysis, among which the RFC-C model had an AUC of 0.803, a sensitivity of 0.588, and a specificity of 0.778 in the test set. Among the models of LR-CS, SVM-CS, and RFC-CS established based on the 16 clinical features after muscle stratification analysis, the LR-CS and SVM-CS models had an AUC of 0.852 in the test set, with a sensitivity of 0.765 and 0.706, respectively, and a specificity of 0.889 and 0.926, respectively. Comparison of the AUC, sensitivity, specificity, precision, F1 score, and accuracy of each model in the test set before and after muscle stratification analysis showed that there were improvements in the parameters of the predictive model after muscle stratification analysis. Comparison of the decision curves and calibration curves of each predictive model showed that the LR-CS and SVM-CS models had good efficacy in predicting postoperative complications (Clavien-Dindo grade≥Ⅲ) in OLT patients. Conclusion On the basis of myosteatosis, the division of the muscle into different subzones according to different densities using the stratified analysis has a certain value in predicting postoperative complications in patients with OLT. -
Key words:
- Myosteatosis /
- Liver Transplantation /
- Postoperative Complications
-
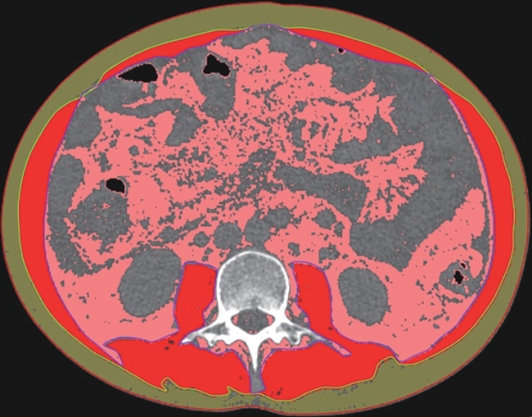
注: 红色区域为全腹壁肌肉,粉色区域为腹腔脂肪,深黄色区域为皮下脂肪。
图 1 Neusoft Fatanalysis软件处理后的L3椎体水平最大层面腹部CT平扫图像
Figure 1. Neusoft Fatanalysis software processing of L3 vertebrae level of the largest abdominal CT scan images
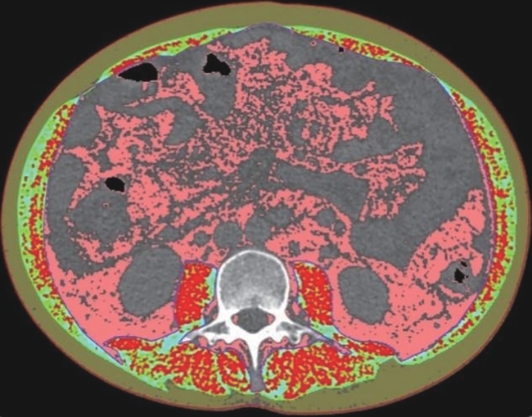
注: 红色区域为NAMA,绿色区域为LAMA,蓝色区域为HAMA,深黄色区域为皮下脂肪。
图 2 肌肉分层分析后Neusoft Fatanalysis软件处理后的L3椎体水平最大层面腹部CT平扫图像
Figure 2. The L3 vertebrae level of the largest abdominal plain CT scan image processed by Neusoft Fatanalysis software after muscle stratification analysis
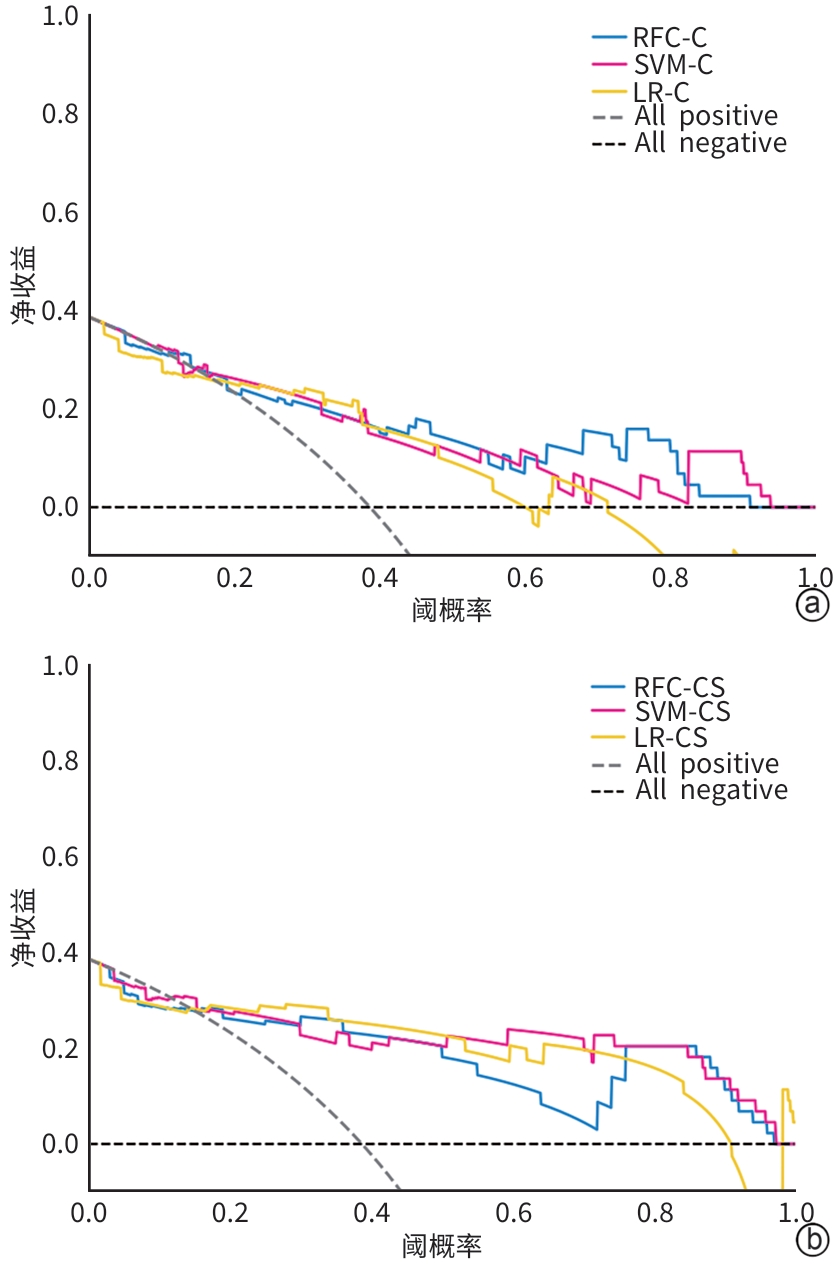
注: a,肌肉分层分析前;b,肌肉分层分析后。
图 6 预测模型的决策分析曲线
Figure 6. The decision curve of predictive models

注: a,肌肉分层分析前;b,肌肉分层分析后。
图 7 预测模型的校正曲线
Figure 7. The calibration curve of predictive models
表 1 训练集和测试集中并发症组和非并发症组患者的人口学信息及临床特征比较
Table 1. Comparison of group differences in demographic and clinical information of patients in the complication group and non-complication group of the training and test sets
指标 训练集(n=101) 测试集(n=44) P值1) 并发症组(n=32) 非并发症组(n=69) P值 并发症组(n=17) 非并发症组(n=27) P值 性别[例(%)] 0.648 0.837 男 22(68.7) 52(75.4) 10(58.8) 18(66.7) 女 10(31.3) 17(24.6) 7(41.2) 9(33.3) 年龄(岁) 52.5(45.5~59.5) 50.0(42.0~57.0) 0.326 51.2±2.4 49.7±2.3 0.666 0.825 身高(cm) 170.0(162.0~175.0) 170.0(170.0~175.0) 0.768 168.2±1.9 168.8±1.3 0.780 0.114 体质量(kg) 65.0(57.5~77.5) 70.0(60.0~80.0) 0.377 61.0(59.0~76.0) 67.0(56.5~73.0) 0.987 0.209 BMI(kg/m2) 23.55±0.81 3.46±0.42 0.443 23.92±1.02 23.13±0.72 0.604 0.392 肌肉脂肪浸润[例(%)] 0.002 0.053 0.073 有 24(75.0) 27(39.1) 15(88.2) 15(55.6) 无 8(25.0) 42(60.9) 2(11.8) 12(44.4) MELD评分(分) 17.5(13.5~22.5) 14.0(10.0~19.0) 0.046 15.0(11.0~16.0) 16.0(10.5~20.5) 0.333 0.640 Child-Pugh评分 9.0(8.0~10.0) 8.0(7.0~9.0) 0.026 9.0(8.0~10.0) 8.0(6.0~9.0) 0.251 0.379 腹部手术史[例(%)] 0.881 0.965 0.458 有 10(31.3) 21(30.4) 6(35.3) 11(40.7) 无 22(68.7) 48(69.6) 11(64.7) 16(59.3) 糖尿病[例(%)] 0.047 0.501 0.343 有 6(18.8) 3(4.3) 4(23.5) 3(11.1) 无 26(81.2) 66(95.7) 13(76.5) 24(88.9) 肝细胞癌射频消融[例(%)] 0.712 0.675 0.751 有 1(3.1) 5(7.2) 2(11.8) 1(3.7) 无 31(96.9) 64(92.8) 15(88.2) 26(96.3) 肝细胞癌动脉栓塞治疗[例(%)] 0.712 0.675 0.863 有 1(3.1) 5(7.2) 2(11.8) 1(3.7) 无 31(96.9) 64(92.8) 15(88.2) 26(96.3) 难以控制的静脉曲张出血[例(%)] 0.948 0.308 0.916 有 6(18.8) 13(18.8) 1(5.9) 6(22.2) 无 26(81.2) 56(81.2) 16(94.1) 21(77.8) 肝性脑病[例(%)] 0.992 0.258 0.353 有 4(12.5) 7(10.1) 5(29.4) 3(11.1) 无 28(87.5) 62(89.9) 12(70.6) 24(88.9) 移植前感染[例(%)] 0.570 0.675 0.538 有 1(3.1) 2(2.9) 2(11.8) 1(3.7) 无 31(96.9) 67(97.1) 15(88.2) 26(96.3) AST(U/L) 64.4(37.9~209.0) 48.4(33.6~87.7) 0.037 51.7(36.3~70.8) 53.8(38.7~124.5) 0.406 0.946 ALT(U/L) 57.1(28.8~219.8) 37.5(21.1~72.1) 0.086 31.4(25.0~59.3) 34.7(22.1~168.0) >0.05 0.650 总胆红素(μmol/L) 74.7(49.0~150.6) 62.0(23.3~145.6) 0.154 67.0(20.0~105.0) 50.5(30.1~175.4) 0.782 0.631 直接胆红素(μmol/L) 52.6(18.6~96.8) 19.4(9.1~93.7) 0.056 36.6(12.7~49.9) 21.4(11.3~111.8) 0.847 0.551 白蛋白(g/L) 31.50(26.85~35.20) 33.40(30.00~37.80) 0.029 33.04±1.70 34.24±1.03 0.523 0.484 WBC(×109) 5.00(2.89~9.60) 3.58(2.46~6.05) 0.053 3.52(2.85~6.35) 3.60(2.78~7.95) 0.838 0.824 PLT(×109) 75.0(52.0~111.0) 59.0(42.0~96.0) 0.140 75.0(46.0~126.0) 72.0(51.5~138.5) 0.952 0.192  下载: 导出CSV
指标 训练集(n=101) 测试集(n=44) P值1) 并发症组(n=32) 非并发症组(n=69) P值 并发症组(n=17) 非并发症组(n=27) P值 PT(s) 17.80(14.70~22.35) 16.10(13.90~19.80) 0.141 14.90(12.20~16.70) 16.20(14.35~18.40)) 0.169 0.290 INR 1.57(1.26~1.96) 1.40(1.18~1.71) 0.119 1.33(1.02~1.49) 1.38(1.22~1.66) 0.189 0.337 Na+(mmol/L) 137.6(133.2~140.1) 135.8(134.2~139.2) 0.951 137.3(131.3~137.8) 137.4(134.4~140.0) 0.219 0.949 肌酐(umol/L) 58.2(46.5~70.9) 62.8(53.1~74.9) 0.196 63.4(51.5~85.7) 55.3(48.8~65.6) 0.219 0.230 SFA(cm2) 124.06±13.21 132.04±8.52 0.605 150.95±22.95 122.67±14.79 0.360 0.766 VFA(cm2) 100.43±9.95 115.25±7.45 0.403 90.95(77.43~120.87) 89.14(42.30~116.07) 0.531 0.076 TFA(cm2) 224.52±19.98 247.72±13.94 0.347 248.32±28.38 211.79±22.66 0.321 0.490 VFA/TFA 0.49±0.03 0.47±0.01 0.965 0.42±0.03 0.42±0.02 0.945 0.107 腰围(cm) 88.63(82.10~96.60) 88.85(82.05~98.55) 0.729 88.93±2.71 86.18±2.00 0.411 0.153 脂肪平均阈值(HU) -81.0(-90.2~-75.7) -83.7(-93.9~-75.6) 0.198 -82.8±3.2 -83.0±3.3 0.958 0.772 SMI(cm2/m2) 40.05±1.56 40.99±0.87 0.570 41.66(35.56~44.98) 40.50(33.23~44.43) 0.720 0.544 SMRA(HU) 29.16±1.52 39.02±0.61 <0.001 28.03±2.52 38.49±1.13 0.001 0.386 注:1)训练集与测试集比较。
下载: 导出CSV
表 2 肌肉分层分析后测量得到的影像学相关参数
Table 2. Radiographic parameters measured after muscle stratification
指标 训练集(n=101) 测试集(n=44) P值1) 并发症组(n=32) 非并发症组(n=69) P值 并发症组(n=17) 非并发症组(n=27) P值 NAMA-SMI(cm2/m2) 23.44±1.40 30.04±0.89 <0.001 22.02(17.62~26.70) 28.73(20.13~36.41) 0.038 0.594 NAMA百分比 0.58±0.02 0.73±0.01 <0.001 0.58±0.04 0.73±0.02 0.001 0.703 NAMA-SMRA(HU) 47.52±0.75 49.10±0.40 0.044 47.70±0.83 48.36±0.70 0.548 0.452 LAMA-SMI(cm2/m2) 11.09±0.59 8.60±0.40 0.002 11.60(6.95~12.58) 8.38(6.12~9.51) 0.047 0.456 LAMA百分比 0.28±0.01 0.21±0.01 0.002 0.59(0.46~0.65) 0.74(0.66~0.81) 0.025 0.909 LAMA-SMRA(HU) 17.68(17.02~18.10) 18.02(17.78~18.56) 0.003 17.34±0.22 18.02±0.15 0.011 0.293 HAMA-SMI(cm2/m2) 4.76(3.77~7.39) 2.10(1.74~2.15) <0.001 6.60(3.59~7.94) 1.87(1.70~2.60) <0.001 0.834 HAMA百分比 0.13(0.11~0.17) 0.05(0.04~0.07) <0.001 0.16(0.09~0.20) 0.05(0.04~0.08) <0.001 0.707 HAMA-SMRA(HU) -23.0(-30.2~-15.4) -13.0(-13.8~-10.0) <0.001 -28.0(-31.3~-13.5) -12.4(-13.6~-9.7) <0.001 0.896 注:1)训练集与测试集比较。
下载: 导出CSV
表 3 测试集中各预测模型相关参数的比较
Table 3. Comparison of correlation parameters of test sets of prediction models
预测模型 AUC 灵敏度 特异度 精确率 F1_分数 准确率 LR-C 0.743 0.588 0.778 0.625 0.606 0.705 RFC-C 0.803 0.588 0.778 0.625 0.606 0.705 SVM-C 0.791 0.647 0.778 0.647 0.647 0.727 LR-CS 0.852 0.765 0.889 0.813 0.788 0.841 RFC-CS 0.825 0.647 0.889 0.786 0.710 0.795 SVM-CS 0.852 0.706 0.926 0.857 0.774 0.841
下载: 导出CSV
-
[1] CORREA-DE-ARAUJO R, ADDISON O, MILJKOVIC I, et al. Myosteatosis in the context of skeletal muscle function deficit: An interdisciplinary workshop at the national institute on aging[J]. Front Physiol, 2020, 11: 963. DOI: 10.3389/fphys.2020.00963. [2] KOTEISH A, DIEHL AM. Animal models of steatosis[J]. Semin Liver Dis, 2001, 21( 1): 89- 104. DOI: 10.1055/s-2001-12932. [3] KIRKLAND JL, TCHKONIA T, PIRTSKHALAVA T, et al. Adipogenesis and aging: Does aging make fat go MAD?[J]. Exp Gerontol, 2002, 37( 6): 757- 767. DOI: 10.1016/s0531-5565(02)00014-1. [4] FARUP J, MADARO L, PURI PL, et al. Interactions between muscle stem cells, mesenchymal-derived cells and immune cells in muscle homeostasis, regeneration and disease[J]. Cell Death Dis, 2015, 6( 7): e1830. DOI: 10.1038/cddis.2015.198. [5] SCHRAUWEN-HINDERLING VB, KOOI ME, HESSELINK MC, et al. Impaired in vivo mitochondrial function but similar intramyocellular lipid content in patients with type 2 diabetes mellitus and BMI-matched control subjects[J]. Diabetologia, 2007, 50( 1): 113- 120. DOI: 10.1007/s00125-006-0475-1. [6] HIBI T, WEI CHIEH AK, CHAN AC, et al. Current status of liver transplantation in Asia[J]. Int J Surg, 2020, 82S: 4- 8. DOI: 10.1016/j.ijsu.2020.05.071. [7] KAIDO T. Recent evolution of living donor liver transplantation at Kyoto University: How to achieve a one-year overall survival rate of 99%?[J]. Hepatobiliary Pancreat Dis Int, 2020, 19( 4): 328- 333. DOI: 10.1016/j.hbpd.2020.06.006. [8] DUTKOWSKI P, OBERKOFLER CE, SLANKAMENAC K, et al. Are there better guidelines for allocation in liver transplantation? A novel score targeting justice and utility in the model for end-stage liver disease era[J]. Ann Surg, 2011, 254( 5): 745-753; discussion753. DOI: 10.1097/SLA.0b013e3182365081. [9] BRAAT AE, BLOK JJ, PUTTER H, et al. The Eurotransplant donor risk index in liver transplantation: ET-DRI[J]. Am J Transplant, 2012, 12( 10): 2789- 2796. DOI: 10.1111/j.1600-6143.2012.04195.x. [10] RANA A, JIE T, PORUBSKY M, et al. The survival outcomes following liver transplantation(SOFT) score: Validation with contemporaneous data and stratification of high-risk cohorts[J]. Clin Transplant, 2013, 27( 4): 627- 632. DOI: 10.1111/ctr.12181. [11] POMMERGAARD HC, DAUGAARD TR, ROSTVED AA, et al. Model for end-stage liver disease score predicts complications after liver transplantation[J]. Langenbecks Arch Surg, 2021, 406( 1): 55- 65. DOI: 10.1007/s00423-020-02018-3. [12] SCHLEGEL A, LINECKER M, KRON P, et al. Risk assessment in high- and low-MELD liver transplantation[J]. Am J Transplant, 2017, 17( 4): 1050- 1063. DOI: 10.1111/ajt.14065. [13] CZIGANY Z, KRAMP W, BEDNARSCH J, et al. Myosteatosis to predict inferior perioperative outcome in patients undergoing orthotopic liver transplantation[J]. Am J Transplant, 2020, 20( 2): 493- 503. DOI: 10.1111/ajt.15577. [14] CZIGANY Z, KRAMP W, LURJE I, et al. The role of recipient myosteatosis in graft and patient survival after deceased donor liver transplantation[J]. J Cachexia Sarcopenia Muscle, 2021, 12( 2): 358- 367. DOI: 10.1002/jcsm.12669. [15] MEISTER FA, BEDNARSCH J, AMYGDALOS I, et al. Various myosteatosis selection criteria and their value in the assessment of short- and long-term outcomes following liver transplantation[J]. Sci Rep, 2021, 11( 1): 13368. DOI: 10.1038/s41598-021-92798-5. [16] SHENVI SD, TABER DJ, HARDIE AD, et al. Assessment of magnetic resonance imaging derived fat fraction as a sensitive and reliable predictor of myosteatosis in liver transplant recipients[J]. HPB(Oxford), 2020, 22( 1): 102- 108. DOI: 10.1016/j.hpb.2019.06.006. [17] AHN H, KIM DW, KO Y, et al. Updated systematic review and meta-analysis on diagnostic issues and the prognostic impact of myosteatosis: A new paradigm beyond sarcopenia[J]. Ageing Res Rev, 2021, 70: 101398. DOI: 10.1016/j.arr.2021.101398. [18] FARON A, SPRINKART AM, KUETTING DLR, et al. Body composition analysis using CT and MRI: Intra-individual intermodal comparison of muscle mass and myosteatosis[J]. Sci Rep, 2020, 10( 1): 11765. DOI: 10.1038/s41598-020-68797-3. [19] DINDO D, DEMARTINES N, CLAVIEN PA. Classification of surgical complications: A new proposal with evaluation in a cohort of 6 336 patients and results of a survey[J]. Ann Surg, 2004, 240( 2): 205- 213. DOI: 10.1097/01.sla.0000133083.54934.ae. [20] XU X, YANG JY, ZHONG L, et al. The clinical value of“Hangzhou Criteria” in the selection of patients with hepatocellular carcinoma for liver transplantation: A report of 1 163 cases on a multi-center basis[J]. Chin J Organ Transplant, 2013, 34( 9): 524- 527. DOI: 10.3760/cma.j.issn.0254-1785.2013.09.004.徐骁, 杨家印, 钟林, 等. 肝癌肝移植“杭州标准”的多中心应用研究: 1 163例报道[J]. 中华器官移植杂志, 2013, 34( 9): 524- 527. DOI: 10.3760/cma.j.issn.0254-1785.2013.09.004. [21] MARTIN L, BIRDSELL L, MACDONALD N, et al. Cancer Cachexia in the age of obesity: Skeletal muscle depletion is a powerful prognostic factor, independent of body mass index[J]. J Clin Oncol, 2013, 31( 12): 1539- 1547. DOI: 10.1200/JCO.2012.45.2722. [22] LI MY, LI XY, GUO Y, et al. Development and assessment of an individualized nomogram to predict colorectal cancer liver metastases[J]. Quant Imaging Med Surg, 2020, 10( 2): 397- 414. DOI: 10.21037/qims.2019.12.16. [23] van GRIETHUYSEN JJM, FEDOROV A, PARMAR C, et al. Computational radiomics system to decode the radiographic phenotype[J]. Cancer Res, 2017, 77( 21): e104- e107. DOI: 10.1158/0008-5472.CAN-17-0339. [24] HAMAGUCHI Y, KAIDO T, OKUMURA S, et al. Impact of quality as well as quantity of skeletal muscle on outcomes after liver transplantation[J]. Liver Transpl, 2014, 20( 11): 1413- 1419. DOI: 10.1002/lt.23970. [25] HAMAGUCHI Y, KAIDO T, OKUMURA S, et al. Proposal for new selection criteria considering pre-transplant muscularity and visceral adiposity in living donor liver transplantation[J]. J Cachexia Sarcopenia Muscle, 2018, 9( 2): 246- 254. DOI: 10.1002/jcsm.12276. [26] ZHUANG CL, SHEN X, HUANG YY, et al. Myosteatosis predicts prognosis after radical gastrectomy for gastric cancer: A propensity score-matched analysis from a large-scale cohort[J]. Surgery, 2019, 166( 3): 297- 304. DOI: 10.1016/j.surg.2019.03.020. [27] KIM DW, KIM KW, KO Y, et al. Assessment of myosteatosis on computed tomography by automatic generation of a muscle quality map using a web-based toolkit: Feasibility study[J]. JMIR Med Inform, 2020, 8( 10): e23049. DOI: 10.2196/23049. [28] SJØBLOM B, GRØNBERG BH, WENTZEL-LARSEN T, et al. Skeletal muscle radiodensity is prognostic for survival in patients with advanced non-small cell lung cancer[J]. Clin Nutr, 2016, 35( 6): 1386- 1393. DOI: 10.1016/j.clnu.2016.03.010. [29] BOWDEN JS, WILLIAMS LJ, SIMMS A, et al. Prediction of 90 day and overall survival after chemoradiotherapy for lung cancer: Role of performance status and body composition[J]. Clin Oncol(R Coll Radiol), 2017, 29( 9): 576- 584. DOI: 10.1016/j.clon.2017.06.005. [30] KUMAR A, MOYNAGH MR, MULTINU F, et al. Muscle composition measured by CT scan is a measurable predictor of overall survival in advanced ovarian cancer[J]. Gynecol Oncol, 2016, 142( 2): 311- 316. DOI: 10.1016/j.ygyno.2016.05.027. [31] AUST S, KNOGLER T, PILS D, et al. Skeletal muscle depletion and markers for cancer Cachexia are strong prognostic factors in epithelial ovarian cancer[J]. PLoS One, 2015, 10( 10): e0140403. DOI: 10.1371/journal.pone.0140403. [32] van RIJSSEN LB, van HUIJGEVOORT NM, COELEN RS, et al. Skeletal muscle quality is associated with worse survival after pancreatoduodenectomy for periampullary, nonpancreatic cancer[J]. Ann Surg Oncol, 2017, 24( 1): 272- 280. DOI: 10.1245/s10434-016-5495-6. [33] OKUMURA S, KAIDO T, HAMAGUCHI Y, et al. Visceral adiposity and sarcopenic visceral obesity are associated with poor prognosis after resection of pancreatic cancer[J]. Ann Surg Oncol, 2017, 24( 12): 3732- 3740. DOI: 10.1245/s10434-017-6077-y. [34] TAMANDL D, PAIREDER M, ASARI R, et al. Markers of sarcopenia quantified by computed tomography predict adverse long-term outcome in patients with resected oesophageal or gastro-oesophageal junction cancer[J]. Eur Radiol, 2016, 26( 5): 1359- 1367. DOI: 10.1007/s00330-015-3963-1. [35] CHU MP, LIEFFERS J, GHOSH S, et al. Skeletal muscle density is an independent predictor of diffuse large B-cell lymphoma outcomes treated with rituximab-based chemoimmunotherapy[J]. J Cachexia Sarcopenia Muscle, 2017, 8( 2): 298- 304. DOI: 10.1002/jcsm.12161. [36] BOER BC, de GRAAFF F, BRUSSE-KEIZER M, et al. Skeletal muscle mass and quality as risk factors for postoperative outcome after open colon resection for cancer[J]. Int J Colorectal Dis, 2016, 31( 6): 1117- 1124. DOI: 10.1007/s00384-016-2538-1. [37] van DIJK DPJ, BAKENS MJAM, COOLSEN MME, et al. Low skeletal muscle radiation attenuation and visceral adiposity are associated with overall survival and surgical site infections in patients with pancreatic cancer[J]. J Cachexia Sarcopenia Muscle, 2017, 8( 2): 317- 326. DOI: 10.1002/jcsm.12155. [38] AKAHORI T, SHO M, KINOSHITA S, et al. Prognostic significance of muscle attenuation in pancreatic cancer patients treated with neoadjuvant chemoradiotherapy[J]. World J Surg, 2015, 39( 12): 2975- 2982. DOI: 10.1007/s00268-015-3205-3. -


 本文二维码
本文二维码
计量
- 文章访问数: 741
- HTML全文浏览量: 352
- PDF下载量: 54
- 被引次数: 0