PDF下载 ( 2631 KB)

基线IgM水平对原发性胆汁性胆管炎治疗应答的预测价值
DOI: 10.3969/j.issn.1001-5256.2022.04.015
Value of baseline IgM level in predicting the treatment response of primary biliary cholangitis
-
摘要:
目的 研究基线IgM水平与原发性胆汁性胆管炎(PBC)患者经熊去氧胆酸(UDCA)治疗应答的关系。 方法 回顾性分析2010年1月—2020年1月解放军总医院第五医学中心确诊的637例UDCA初治PBC患者的临床资料。将PBC患者分为UDCA完全应答组(n=436)和UDCA应答不良组(n=201),比较两组患者的临床基线资料。根据基线指标预测治疗应答不良风险的受试者工作特征曲线下面积(AUC)确定IgM的最佳临界值,将患者分为IgM≥1.5×ULN组与IgM<1.5×ULN组,分析患者组间基线参数、治疗应答及预后模型评分的差异。符合正态分布的计量资料两组间比较使用t检验,非正态分布的计量资料两组间比较使用Mann-Whitney U检验;计数资料两组间比较使用χ2检验。亚组分析使用Cochran-Mantel-Haenszel检验,并绘制风险值森林图。 结果 UDCA应答不良组患者基线存在肝硬化、TBil、AST、ALP、总胆汁酸、总胆固醇、IgA、IgM水平及抗Gp210阳性率均明显高于完全应答组患者(χ2=4.596,Z值分别为-9.932、-8.931、-8.361、-7.836、-4.694、-3.242、-2.115,χ2=15.931,P值均<0.05)。Mayo风险评分(MRS)、Globe评分、UK-PBC风险评分在应答不良组均显著高于完全应答组(t=4.092,Z值分别为-10.910、-11.646,P值均<0.001)。IgM升高组患者AST、ALP、总胆固醇、IgA、IgG水平及抗Gp210阳性率显著高于IgM正常组(Z值分别为-3.774、-5.063、-4.344、-2.051、-6.144,χ2=25.180,P值均<0.05)。IgM预测UDCA应答不良的AUC为0.552。IgM≥1.5×ULN组患者的AST、ALP、总胆固醇、IgG、抗Gp210阳性率、UDCA应答不良率高于IgM<1.5×ULN组患者(Z值分别为-4.193、-5.044、-3.250、-5.465,χ2=25.204、8.948,P值均<0.05)。IgM≥1.5×ULN预测应答不良风险值为1.416 (95%CI:1.129~1.776, P=0.003)。亚组分析中,无肝硬化患者,IgM≥1.5×ULN预测应答不良风险值为1.821(95%CI:1.224~2.711, P=0.003)。 结论 基线IgM水平对于预测UDCA应答具有重要价值,基线IgM水平较高的PBC患者,治疗中应密切监测IgM水平,如持续异常,应及时联合二线药物治疗。 Abstract:Objective To investigate the association between baseline IgM level and treatment response to ursodeoxycholic acid (UDCA) in patients with primary biliary cholangitis (PBC). Methods A retrospective analysis was performed for the clinical data of 637 PBC patients who were diagnosed and treated with UDCA for the first time in The Fifth Medical Center of Chinese PLA General Hospital from January 2010 to January 2020. The PBC patients were divided into UDCA complete response group with 436 patients and UDCA poor response group with 201 patients, and baseline clinical data were compared between the two groups. According to the optimal cut-off value of IgM determined by the area under the ROC curve (AUC) of baseline indices in predicting the risk of poor treatment response, the patients were divided into IgM ≥1.5×ULN group and IgM < 1.5×ULN group, and baseline parameters, treatment response, and prognostic model score were compared between groups. The t-test was used for comparison of normally distributed continuous data between two groups, and the Mann-Whitney U test was used for comparison of non-normally distributed continuous data between two groups; the chi-square test was used for comparison of categorical data between two groups. The Cochran-Mantel-Haenszel test was used for subgroup analysis, and forest plots were plotted for related risk values. Results Compared with the UDCA complete response group, the UDCA poor response group had significantly higher proportion of patients with liver cirrhosis, levels of total bilirubin, aspartate aminotransferase (AST), alkaline phosphatase (ALP), total bile acid, total cholesterol (TC), IgA, and IgM, and positive rate of anti-Gp210 antibody at baseline (χ2=4.596, Z=-9.932, -8.931, -8.361, -7.836, -4.694, -3.242, and -2.115, χ2=15.931, all P < 0.05). The UDCA poor response group had significantly higher Mayo Risk Score, Globe score, and UK-PBC risk score than the UDCA complete response group (t=4.092, Z=-10.910 and -11.646, all P < 0.001). Compared with the normal IgM group, the elevated IgM group had significantly higher levels of AST, ALP, TC, IgA, and IgG and a significantly higher positive rate of anti-Gp210 antibody (Z=-3.774, -5.063, -4.344, -2.051, and -6.144, χ2=25.180, all P < 0.05). IgM had an AUC of 0.552 in predicting poor treatment response. Compared with the IgM < 1.5×ULN group, the IgM ≥1.5×ULN group had significantly higher levels of AST, ALP, TC, and IgG, a significantly higher positive rate of anti-Gp210 antibody, and a significantly higher poor UDCA response rate (Z=-4.193, -5.044, -3.250, and -5.465, χ2=25.204 and 8.948, all P < 0.05). IgM ≥1.5×ULN had an odds ratio of 1.416 (95% confidence interval [CI]: 1.129-1.776, P=0.003) in predicting poor response. The subgroup analysis showed that for patients without liver cirrhosis, IgM ≥1.5×ULN had an odds ratio of 1.821 (95%CI: 1.224-2.711, P=0.003) in predicting poor response. Conclusion Baseline IgM level has an important value in predicting UDCA response. IgM level should be closely monitored during treatment in PBC patients with a high baseline IgM level, and second-line drugs should be given in time if the abnormality persists. -
Key words:
- Primary Biliary Cholangitis /
- Cholestasis /
- Immunoglobulin M /
- Therapeutics
-
原发性胆汁性胆管炎(PBC)是一种慢性进行性的胆汁淤积性肝病,90%以上的患者血清抗线粒体抗体(AMA)阳性,部分患者血清IgM水平升高,随着病情的缓解而有所下降[1],因此明确IgM水平与PBC发生、发展及转归的关系,对于指导PBC治疗及预后评估具有重要的临床意义。
1. 资料与方法
1.1 研究对象
选取2010年1月—2020年1月于解放军总医院第五医学中心就诊的熊去氧胆酸(UDCA)初治PBC患者637例,所有患者均具有治疗1年以上的临床数据。纳入标准:(1)符合PBC诊断标准[2-3];(2)UDCA规范治疗(13~15 mg/kg)1年以上。排除标准:(1)合并其他的慢性肝病;(2)肝移植术后;(3)合并其他免疫性疾病、恶性肿瘤及感染性疾病;(4)资料不完整。
1.2 研究方法
采用回顾性分析的方法,采集患者性别、年龄及入院基线的血液学指标、生化指标、免疫学指标及影像学指标;并根据巴黎标准进行UDCA疗效判定[4-5],将PBC患者分为UDCA完全应答组和UDCA应答不良组(包括无应答及部分应答)。
1.3 统计学方法
应用SPSS 22.0软件进行统计学分析。计量资料进行S-K正态性检验,符合正态分布的计量资料用x±s表示,两组间比较采用独立样本t检验;非正态分布的计量资料用M(P25~P75)表示,两组间比较采用Mann-Whitney U检验。计数资料两组间比较采用χ2检验。绘制受试者工作特征曲线(ROC曲线),根据ROC曲线下面积(AUC)评估其预测效能,计算约登指数确定最佳临界值。亚组分析使用Cochran-Mantel-Haenszel(CMH)检验,并绘制风险值森林图。P<0.05为差异有统计学意义。
2. 结果
2.1 一般情况
本研究共纳入PBC患者637例,其中男126例,女511例,平均56岁(50~66岁),基线IgM升高者357例(56.0%),UDCA完全应答者436例(68.4%),其他基线资料见表 1。
表 1 PBC患者基线特征及UDCA治疗1年后的应答情况Table 1. Characteristics of patients with PBC at baseline and biochemical response to UDCA after 1 year of treatment基线特征 数值 性别[例(%)] 男 126(19.8) 女 511(80.2) 发病年龄(岁) 56(50~66) 肝硬化[例(%)] 487(76.5) PLT(×109/L) 121(77~182) Alb(g/L) 35(31~38) TBil(μmol/L) 20.7(13.8~38.2) ALT(U/L) 53(27~95) AST(U/L) 69(41~105) ALP(U/L) 247(158~432) GGT(U/L) 163(81~374) TBA(μmol/L) 28(12~65) ChE(U/L) 4405(2922~5947) TC(mmol/L) 4.4(3.3~5.8) PT(s) 11.6(10.5~12.9) INR 1.01(0.94~1.12) IgA(g/L) 2.68(1.84~3.87) IgG(g/L) 15.67(12.83~20.41) IgM(g/L) 2.76(1.61~4.43) IgM>ULN[例(%)] 357(56.0) ANA阳性[例(%)] 469(73.6) 抗Sp100阳性[例(%)] 94(14.8) 抗Gp210阳性[例(%)] 218(34.2) MRS[6] 5.84±1.45 Globe评分[7] 1.21(0.34~2.11) UK-PBC评分[8] 0.037(0.015~0.112) UDCA治疗1年[例(%)] 完全应答 436(68.4) 应答不良 201(31.6) 注:TBA,总胆汁酸;ChE,胆碱酯酶。 2.2 UDCA不同疗效的基线临床资料比较
按照UDCA治疗应答情况,637例患者中436例发生完全应答,201例为应答不良。性别分布中,完全应答组与应答不良组分布无统计学意义(P值均>0.05),基线存在肝硬化的患者UDCA应答率更高(78.9% vs 71.1%,P=0.032),生化指标中,TBil、AST、ALP、TBA和TC在两组间存在统计学差异(P值均<0.001)。免疫指标中,应答不良组IgA、IgM水平及抗Gp210阳性率均较高(P值均<0.05)。预后风险评分中,应答不良组MRS、Globe评分、UK-PBC评分均高于完全应答组(P值均<0.001)(表 2)。
表 2 UDCA治疗完全应答与应答不良患者基线指标及风险评分差异Table 2. Differences of baseline characteristics and risk scores between PBC with complete response and poor response to UDCA treatment指标 UDCA完全应答组(n=436) UDCA应答不良组(n=201) 统计值 P值 性别[例(%)] χ2=3.112 0.078 男 78(17.9) 48(23.9) 女 358(82.1) 153(76.1) 年龄(岁) 57(50~66) 54(49~65) Z=-1.447 0.148 肝硬化[例(%)] 344(78.9) 143(71.1) χ2=4.596 0.032 TBil(μmol/L) 17.5(12.1~26.1) 39.2(20.6~62.7) Z=-9.932 <0.001 AST(U/L) 55(38~87) 99(69~135) Z=-8.931 <0.001 ALP(U/L) 201(150~340) 390(237~599) Z=-8.361 <0.001 TBA(μmol/L) 22(9~43) 54(20~121) Z=-7.836 <0.001 TC(mmol/L) 4.2(3.2~5.3) 5.1(3.5~7.1) Z=-4.694 <0.001 IgA(g/L) 2.55(1.75~3.61) 3.01(2.01~4.38) Z=-3.242 0.001 IgG(g/L) 15.59(12.63~20.50) 15.73(12.97~20.16) Z=-0.227 0.821 IgM(g/L) 2.60(1.56~4.30) 3.33(1.78~5.02) Z=-2.115 0.034 ANA阳性[例(%)] 313(71.8) 156(77.6) χ2=2.402 0.121 抗Sp100阳性[例(%)] 66(15.1) 28(13.9) χ2=0.159 0.690 抗Gp210阳性[例(%)] 127(29.1) 91(45.3) χ2=15.931 <0.001 MRS 5.68±1.45 6.18±1.41 t=4.092 <0.001 Globe评分 0.83(0.14~1.66) 2.09(1.29~2.81) Z=-10.910 <0.001 UK-PBC评分 0.025(0.012~0.058) 0.128(0.050~0.324) Z=-11.646 <0.001 2.3 不同IgM水平PBC患者临床特征及UDCA疗效比较
2.3.1 IgM升高与IgM正常PBC患者基线特征及治疗应答差异
按照IgM升高与IgM正常将PBC患者分为两组,分析患者基线特征及治疗应答。性别分布、年龄、肝硬化占比在两组中比较差异均无统计学意义(P值均>0.05);生化指标中,AST、ALP、TC在IgM升高组显著高于IgM正常组(P值均<0.001);免疫指标中,IgA、IgG水平及抗Gp210阳性率在IgM升高组显著高于IgM正常组(P值均<0.05),但两组在UDCA治疗应答方面并无统计学差异(P>0.05)(表 3)。
表 3 IgM升高与IgM正常的PBC患者基线特征及治疗应答差异Table 3. Differences of baseline characteristics and biochemical response to UDCA treatment between IgM-normal and IgM-elevated PBC指标 IgM升高组(n=357) IgM正常组(n=280) 统计值 P值 性别[例(%)] χ2=0.525 0.469 男 67(18.8) 59(21.1) 女 290(81.2) 221(78.9) 年龄(岁) 55(49~65) 57(50~67) Z=-1.776 0.076 肝硬化[例(%)] 275(77.0) 212(75.7) χ2=0.151 0.698 TBil(μmol/L) 20.4(14.0~38.2) 21.1(13.6~38.6) Z=-0.066 0.947 AST(U/L) 75(45~106) 55(35~100) Z=-3.774 <0.001 ALP(U/L) 275(173~478) 201(144~347) Z=-5.063 <0.001 TBA(μmol/L) 29(13~60) 28(11~70) Z=-0.587 0.558 TC(mmol/L) 4.8(3.6~6.2) 4.2(3.1~5.3) Z=-4.344 <0.001 IgA(g/L) 2.83(1.96~3.91) 2.53(1.70~3.82) Z=-2.051 0.040 IgG(g/L) 16.88(14.00~21.42) 14.04(11.87~18.50) Z=-6.144 <0.001 ANA阳性[例(%)] 270(75.6) 199(71.1) χ2=1.680 0.195 抗Sp100阳性[例(%)] 56(15.7) 38(13.6) χ2=0.558 0.455 抗Gp210阳性[例(%)] 152(42.6) 66(23.6) χ2=25.180 <0.001 MRS 5.78±1.46 5.91±1.43 t=-1.071 0.284 Globe评分 1.18(0.29~2.12) 1.27(0.36~2.07) Z=-0.433 0.665 UK-PBC评分 0.038(0.015~0.114) 0.037(0.015~0.108) Z=-0.416 0.677 UDCA治疗1年[例(%)] χ2=2.580 0.108 完全应答 235(65.8) 201(71.8) 应答不良 122(34.2) 79(28.2) 2.3.2 应用ROC曲线确定IgM最佳临界值
将各项基线指标进行ROC曲线分析(图 1,表 4),结果显示预测UDCA治疗1年后应答不良的生化指标包括TBil、AST、ALP、TBA、TC,免疫指标包括IgA、IgM、IgG,计算IgM最佳临界值为1.5×ULN。
 图 1 PBC患者基线指标预测UDCA治疗1年后应答不良的ROC曲线Figure 1. ROC curves of characteristics at baseline in predicting poor response to UDCA after 1 year of treatment表 4 PBC患者基线指标预测UDCA治疗1年后应答不良的AUCTable 4. AUC values of characteristics at baseline in predicting poor biochemical response to UDCA after 1 year of treatment
指标 AUC 95%CI TBil 0.745 0.709~0.778 AST 0.720 0.683~0.755 ALP 0.706 0.669~0.741 TBA 0.693 0.655~0.728 TC 0.615 0.576~0.653 IgA 0.576 0.537~0.615 IgM 0.552 0.512~0.591 IgG 0.505 0.466~0.545 2.3.3 分析不同IgM水平PBC患者基线特征及治疗应答差异
根据IgM预测UDCA应答不良的最佳临界值将患者分为IgM≥1.5×ULN及IgM<1.5×ULN两组,性别分布、年龄、肝硬化占比在两组中比较差异均无统计学意义(P值均>0.05);IgM≥1.5×ULN组AST、ALP、TC显著高于IgM<1.5×ULN组(P值均<0.05);IgM≥1.5×ULN组IgG水平及抗Gp210阳性率显著高于IgM<1.5×ULN组(P值均<0.001)。IgM≥1.5×ULN组经过UDCA治疗后发生应答不良患者显著高于IgM<1.5×ULN组(38.3% vs 27.1%,P=0.003)(表 5)。
表 5 不同IgM水平PBC患者基线临床特征及UDCA疗效比较Table 5. Comparison of baseline characteristics and the outcome of UDCA treatment between PBC with different levels of IgM指标 IgM≥1.5×ULN组(n=253) IgM<1.5×ULN组(n=384) 统计值 P值 性别[例(%)] χ2=0.038 0.846 男 51(20.2) 75(19.5) 女 202(79.8) 309(80.5) 年龄(岁) 56(49~65) 56(50~66) Z=-1.077 0.281 肝硬化[例(%)] 195(77.1) 292(76.0) χ2=0.090 0.764 TBil(μmol/L) 21.0(14.3~38.0) 20.5(13.6~39.7) Z=-0.244 0.808 AST(U/L) 78(46~112) 61(38~99) Z=-4.193 <0.001 ALP(U/L) 288(179~492) 210(150~358) Z=-5.044 <0.001 TBA(μmol/L) 28(13~57) 28(10~70) Z=-0.210 0.834 TC(mmol/L) 4.8(3.6~6.3) 4.3(3.2~5.5) Z=-3.250 0.001 IgA(g/L) 2.81(1.90~3.85) 2.63(1.76~3.87) Z=-1.021 0.307 IgG(g/L) 17.60(14.09~22.10) 14.89(12.15~19.32) Z=-5.465 <0.001 ANA阳性[例(%)] 192(75.9) 277(72.1) χ2=1.107 0.293 抗Sp100阳性[例(%)] 44(17.4) 50(13.0) χ2=2.316 0.128 抗Gp210阳性[例(%)] 116(45.8) 102(26.6) χ2=25.204 <0.001 MRS 5.71±1.43 5.92±1.46 t=-1.792 0.074 Globe评分 1.17(0.36~2.14) 1.28(0.29~2.07) Z=-0.161 0.872 UK-PBC评分 0.038(0.014~0.119) 0.037(0.015~0.109) Z=-0.481 0.631 UDCA治疗1年[例(%)] χ2=8.948 0.003 完全应答 156(61.7) 280(72.9) 应答不良 97(38.3) 104(27.1) 2.4 不同IgM水平预测应答不良的风险分析森林图
对IgM≥1.5×ULN组及IgM<1.5×ULN组两组的各项指标进行预测应答不良的风险值分析,结果显示IgM≥1.5×ULN组相对IgM<1.5×ULN组预测整体应答不良的风险值为1.416 (95%CI:1.129~1.776, P=0.003)。亚组分析中,无肝硬化患者,IgM≥1.5×ULN预测应答不良风险值为1.821(95%CI:1.224~2.711, P=0.003)。其他情况详见图 2。
 图 2 IgM≥1.5×ULN相对IgM<1.5×ULN预测治疗应答情况亚组分析森林图Figure 2. Forest plot for subgroup analysis by IgM≥1.5×ULN versus IgM < 1.5×ULN in predicting treatment response of UDCA
3. 讨论
IgM具有强大的杀菌、激活补体、免疫调理和凝集作用,通常出现在初次体液免疫应答的最早阶段,是连接固有免疫和获得性免疫的纽带,也参与某些自身免疫疾病和超敏反应的病理过程。PBC是一种器官特异性的自身免疫性疾病,IgM升高是PBC典型的血清学特征之一,但是其升高的机制至今尚未完全阐明,外源微生物的分子模拟、免疫耐受性的破坏、免疫功能紊乱可能是导致高IgM水平的重要原因[9-10],IgM在PBC疾病进程中可能发挥免疫调节及免疫损伤的双重作用[9]。不同于PBC,自身免疫性肝炎(AIH)患者以IgG升高为主,其水平随着病情缓解而逐渐下降,IgG是AIH疾病转归的重要监测指标之一。作为PBC常规检测项目,IgM并未被国内外指南纳入诊疗和预后评估的指标。IgM在PBC发生、发展、疗效及转归中是否具有预测价值,目前尚缺乏大量的临床研究结果作为指导。
UDCA是PBC治疗的一线药物,可显著改善部分PBC患者非肝移植存活率[11-12],但仍有30%~40%的患者对UDCA治疗无应答,本研究中显示UDCA完全应答率为68.4%,对于这部分患者需要及时联合一种或两种二线药物来改善胆汁淤积以预防疾病进展[13]。UDCA治疗可能影响IgM水平,研究[14]发现UDCA能够显著降低细菌CpG诱导的总IgM和IgM-AMA的产生,但对IgG-AMA的水平却无影响。IgM与肝硬化相关症状和肝脏相关事件的发生关系密切,在UDCA联合苯扎贝特治疗过程中,不论ALP及GGT下降与否,当IgM水平持续异常时,患者的预后均较差,其生存期显著低于IgM水平正常化的患者,治疗过程中IgM水平的逐步正常化可能提示预后较好[15]。对于UDCA不完全应答的PBC患者,在给予联合利妥昔单抗治疗后,IgM水平随着肝功能指标的好转而逐步下降[16]。IgM正常化可作为长期预后的预测指标,但初始IgM正常患者IgM水平的变化情况及预测因素尚缺乏研究。在本研究中,UDCA治疗基线IgM平均水平为2.76 g/L,IgM升高的占比为56.0%,在UDCA完全应答组与应答不良组之间,基线IgM水平存在显著性差异(P=0.034),进一步分析IgM升高与IgM正常组患者的临床特征及在UDCA治疗1年后的疗效差异,发现IgM正常组UDCA应答率高于IgM升高组(71.8% vs 65.8%),但两组差异无统计学意义(P=0.108),通过ROC曲线分析获得IgM预测UDCA治疗1年后应答不良风险的最佳临界值(1.5×ULN),按最佳临界值进行分组后,结果显示IgM<1.5×ULN组的PBC患者发生UDCA应答率显著高于IgM≥1.5×ULN组(72.9% vs 61.7%, P=0.003),IgM≥1.5×ULN组发生UDCA应答不良风险是前者的1.416倍(95%CI: 1.129~1.776),因此基线IgM水平可能有助于预测PBC治疗应答。
IgM是进展期PBC的危险因素,与PBC胆管损伤及纤维化密切相关。进展期PBC的肝组织中IgM表达水平显著升高[17],在胆道闭锁的患儿中,靶向胆管上皮细胞的IgM自身抗体能够激活补体并参与肝纤维化的发生,从而使疾病不断进展[18-19]。在本研究中血清IgM升高组的PBC患者,其肝硬化占比也偏高,因是回顾性研究,患者缺乏UDCA治疗基线及治疗后的组织学证据,无法评估IgM与疾病进展、转归之间的相关性,今后尚需要进一步完善。
UDCA生化应答的PBC患者具有较好的预后,即使进展为肝硬化的患者,如仍处于代偿期,也可达到延长生存期、降低肝病相关病死率及肝移植需求的目标[20]。MRS是一种常用的预测生存概率模型,最初用于筛选肝移植对象和确定肝移植手术时机[6],MRS对于失代偿期肝硬化的PBC患者也具有较强的预测性。UK-PBC评分[8]及GLOBE评分[7]是近年来被采用的PBC预后模型。在接受UDCA治疗的PBC患者中,MRS、UK-PBC评分和GLOBE评分对患者肝移植或死亡的风险预测均具有较好的准确性[21]。本研究结果显示MRS、Globe评分、UK-PBC评分在UDCA完全应答组及应答不良组之间均具有显著性差异,提示UDCA完全应答组的非肝移植存活率均显著高于应答不良组,但在IgM升高组和正常组之间以及IgM≥1.5×ULN组和IgM<1.5×ULN组之间,三种预测模型评分均无明显差异,这说明基线IgM水平还不能作为独立预测非肝移植存活率的指标。
总之,本研究结果提示基线IgM水平对于预测UDCA应答具有重要价值,基线IgM水平较高的PBC患者,治疗中应密切监测IgM水平,如持续异常,应及时联合二线药物治疗。
-
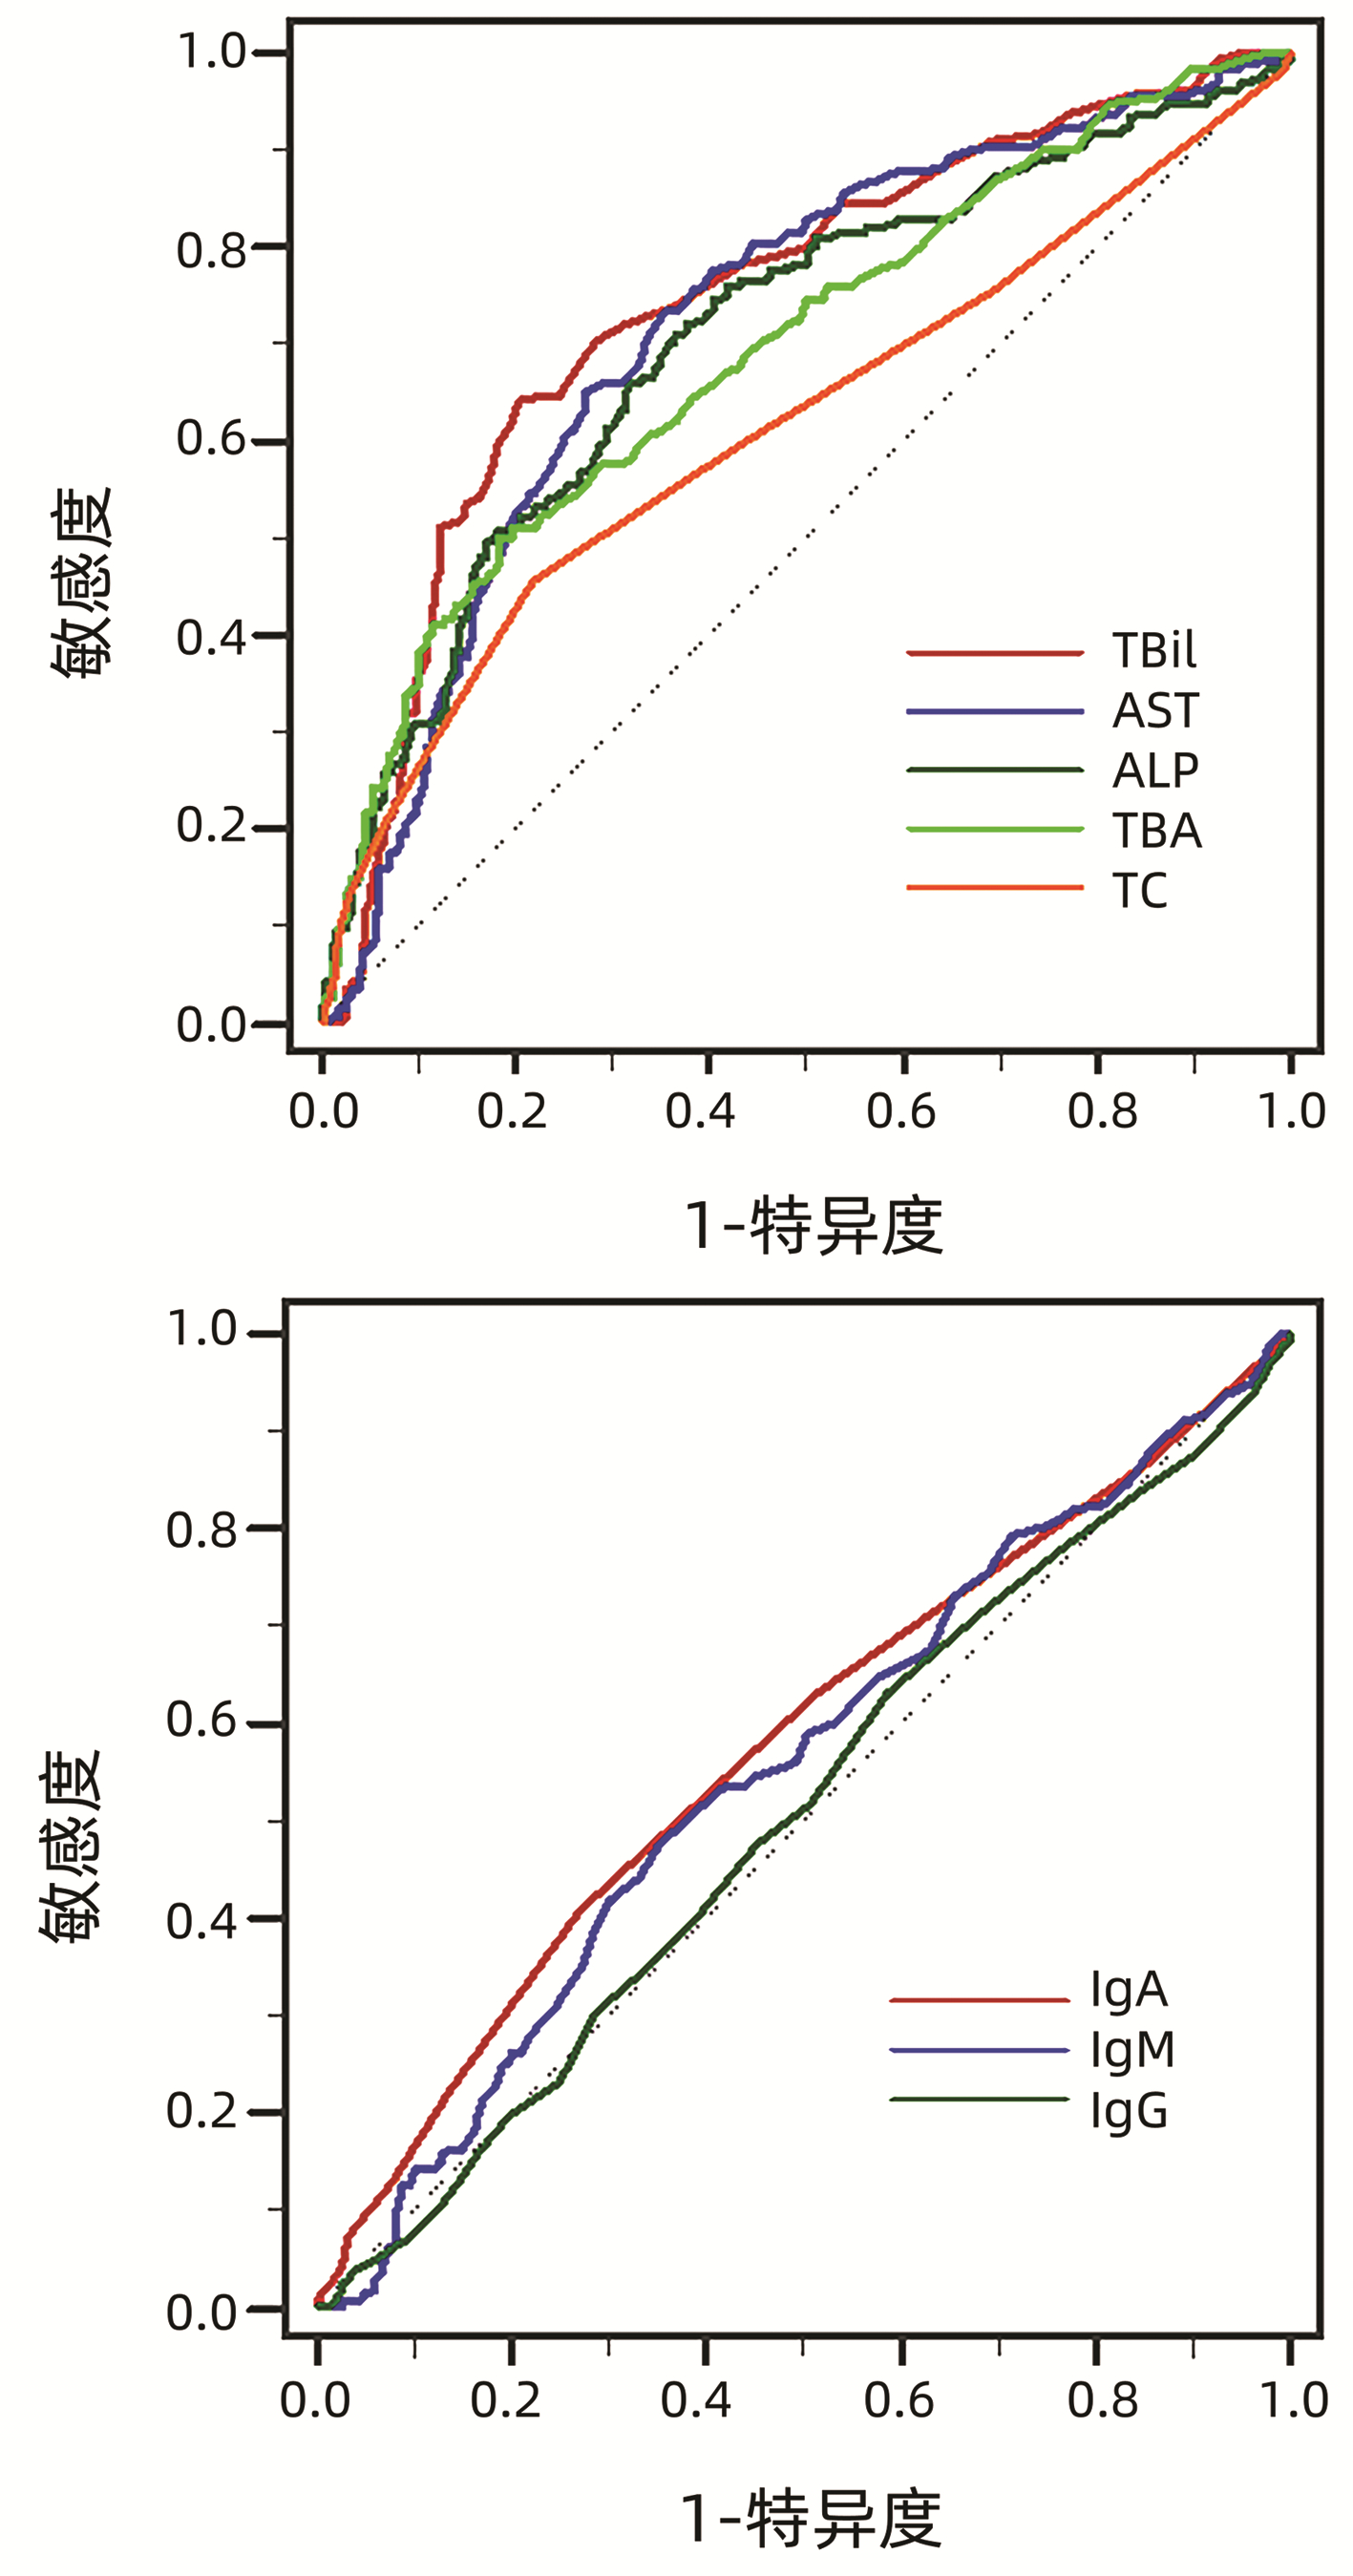
图 1 PBC患者基线指标预测UDCA治疗1年后应答不良的ROC曲线
Figure 1. ROC curves of characteristics at baseline in predicting poor response to UDCA after 1 year of treatment

图 2 IgM≥1.5×ULN相对IgM<1.5×ULN预测治疗应答情况亚组分析森林图
Figure 2. Forest plot for subgroup analysis by IgM≥1.5×ULN versus IgM < 1.5×ULN in predicting treatment response of UDCA
表 1 PBC患者基线特征及UDCA治疗1年后的应答情况
Table 1. Characteristics of patients with PBC at baseline and biochemical response to UDCA after 1 year of treatment
基线特征 数值 性别[例(%)] 男 126(19.8) 女 511(80.2) 发病年龄(岁) 56(50~66) 肝硬化[例(%)] 487(76.5) PLT(×109/L) 121(77~182) Alb(g/L) 35(31~38) TBil(μmol/L) 20.7(13.8~38.2) ALT(U/L) 53(27~95) AST(U/L) 69(41~105) ALP(U/L) 247(158~432) GGT(U/L) 163(81~374) TBA(μmol/L) 28(12~65) ChE(U/L) 4405(2922~5947) TC(mmol/L) 4.4(3.3~5.8) PT(s) 11.6(10.5~12.9) INR 1.01(0.94~1.12) IgA(g/L) 2.68(1.84~3.87) IgG(g/L) 15.67(12.83~20.41) IgM(g/L) 2.76(1.61~4.43) IgM>ULN[例(%)] 357(56.0) ANA阳性[例(%)] 469(73.6) 抗Sp100阳性[例(%)] 94(14.8) 抗Gp210阳性[例(%)] 218(34.2) MRS[6] 5.84±1.45 Globe评分[7] 1.21(0.34~2.11) UK-PBC评分[8] 0.037(0.015~0.112) UDCA治疗1年[例(%)] 完全应答 436(68.4) 应答不良 201(31.6) 注:TBA,总胆汁酸;ChE,胆碱酯酶。  下载: 导出CSV
表 2 UDCA治疗完全应答与应答不良患者基线指标及风险评分差异
Table 2. Differences of baseline characteristics and risk scores between PBC with complete response and poor response to UDCA treatment
指标 UDCA完全应答组(n=436) UDCA应答不良组(n=201) 统计值 P值 性别[例(%)] χ2=3.112 0.078 男 78(17.9) 48(23.9) 女 358(82.1) 153(76.1) 年龄(岁) 57(50~66) 54(49~65) Z=-1.447 0.148 肝硬化[例(%)] 344(78.9) 143(71.1) χ2=4.596 0.032 TBil(μmol/L) 17.5(12.1~26.1) 39.2(20.6~62.7) Z=-9.932 <0.001 AST(U/L) 55(38~87) 99(69~135) Z=-8.931 <0.001 ALP(U/L) 201(150~340) 390(237~599) Z=-8.361 <0.001 TBA(μmol/L) 22(9~43) 54(20~121) Z=-7.836 <0.001 TC(mmol/L) 4.2(3.2~5.3) 5.1(3.5~7.1) Z=-4.694 <0.001 IgA(g/L) 2.55(1.75~3.61) 3.01(2.01~4.38) Z=-3.242 0.001 IgG(g/L) 15.59(12.63~20.50) 15.73(12.97~20.16) Z=-0.227 0.821 IgM(g/L) 2.60(1.56~4.30) 3.33(1.78~5.02) Z=-2.115 0.034 ANA阳性[例(%)] 313(71.8) 156(77.6) χ2=2.402 0.121 抗Sp100阳性[例(%)] 66(15.1) 28(13.9) χ2=0.159 0.690 抗Gp210阳性[例(%)] 127(29.1) 91(45.3) χ2=15.931 <0.001 MRS 5.68±1.45 6.18±1.41 t=4.092 <0.001 Globe评分 0.83(0.14~1.66) 2.09(1.29~2.81) Z=-10.910 <0.001 UK-PBC评分 0.025(0.012~0.058) 0.128(0.050~0.324) Z=-11.646 <0.001
下载: 导出CSV
表 3 IgM升高与IgM正常的PBC患者基线特征及治疗应答差异
Table 3. Differences of baseline characteristics and biochemical response to UDCA treatment between IgM-normal and IgM-elevated PBC
指标 IgM升高组(n=357) IgM正常组(n=280) 统计值 P值 性别[例(%)] χ2=0.525 0.469 男 67(18.8) 59(21.1) 女 290(81.2) 221(78.9) 年龄(岁) 55(49~65) 57(50~67) Z=-1.776 0.076 肝硬化[例(%)] 275(77.0) 212(75.7) χ2=0.151 0.698 TBil(μmol/L) 20.4(14.0~38.2) 21.1(13.6~38.6) Z=-0.066 0.947 AST(U/L) 75(45~106) 55(35~100) Z=-3.774 <0.001 ALP(U/L) 275(173~478) 201(144~347) Z=-5.063 <0.001 TBA(μmol/L) 29(13~60) 28(11~70) Z=-0.587 0.558 TC(mmol/L) 4.8(3.6~6.2) 4.2(3.1~5.3) Z=-4.344 <0.001 IgA(g/L) 2.83(1.96~3.91) 2.53(1.70~3.82) Z=-2.051 0.040 IgG(g/L) 16.88(14.00~21.42) 14.04(11.87~18.50) Z=-6.144 <0.001 ANA阳性[例(%)] 270(75.6) 199(71.1) χ2=1.680 0.195 抗Sp100阳性[例(%)] 56(15.7) 38(13.6) χ2=0.558 0.455 抗Gp210阳性[例(%)] 152(42.6) 66(23.6) χ2=25.180 <0.001 MRS 5.78±1.46 5.91±1.43 t=-1.071 0.284 Globe评分 1.18(0.29~2.12) 1.27(0.36~2.07) Z=-0.433 0.665 UK-PBC评分 0.038(0.015~0.114) 0.037(0.015~0.108) Z=-0.416 0.677 UDCA治疗1年[例(%)] χ2=2.580 0.108 完全应答 235(65.8) 201(71.8) 应答不良 122(34.2) 79(28.2)
下载: 导出CSV
表 4 PBC患者基线指标预测UDCA治疗1年后应答不良的AUC
Table 4. AUC values of characteristics at baseline in predicting poor biochemical response to UDCA after 1 year of treatment
指标 AUC 95%CI TBil 0.745 0.709~0.778 AST 0.720 0.683~0.755 ALP 0.706 0.669~0.741 TBA 0.693 0.655~0.728 TC 0.615 0.576~0.653 IgA 0.576 0.537~0.615 IgM 0.552 0.512~0.591 IgG 0.505 0.466~0.545
下载: 导出CSV
表 5 不同IgM水平PBC患者基线临床特征及UDCA疗效比较
Table 5. Comparison of baseline characteristics and the outcome of UDCA treatment between PBC with different levels of IgM
指标 IgM≥1.5×ULN组(n=253) IgM<1.5×ULN组(n=384) 统计值 P值 性别[例(%)] χ2=0.038 0.846 男 51(20.2) 75(19.5) 女 202(79.8) 309(80.5) 年龄(岁) 56(49~65) 56(50~66) Z=-1.077 0.281 肝硬化[例(%)] 195(77.1) 292(76.0) χ2=0.090 0.764 TBil(μmol/L) 21.0(14.3~38.0) 20.5(13.6~39.7) Z=-0.244 0.808 AST(U/L) 78(46~112) 61(38~99) Z=-4.193 <0.001 ALP(U/L) 288(179~492) 210(150~358) Z=-5.044 <0.001 TBA(μmol/L) 28(13~57) 28(10~70) Z=-0.210 0.834 TC(mmol/L) 4.8(3.6~6.3) 4.3(3.2~5.5) Z=-3.250 0.001 IgA(g/L) 2.81(1.90~3.85) 2.63(1.76~3.87) Z=-1.021 0.307 IgG(g/L) 17.60(14.09~22.10) 14.89(12.15~19.32) Z=-5.465 <0.001 ANA阳性[例(%)] 192(75.9) 277(72.1) χ2=1.107 0.293 抗Sp100阳性[例(%)] 44(17.4) 50(13.0) χ2=2.316 0.128 抗Gp210阳性[例(%)] 116(45.8) 102(26.6) χ2=25.204 <0.001 MRS 5.71±1.43 5.92±1.46 t=-1.792 0.074 Globe评分 1.17(0.36~2.14) 1.28(0.29~2.07) Z=-0.161 0.872 UK-PBC评分 0.038(0.014~0.119) 0.037(0.015~0.109) Z=-0.481 0.631 UDCA治疗1年[例(%)] χ2=8.948 0.003 完全应答 156(61.7) 280(72.9) 应答不良 97(38.3) 104(27.1)
下载: 导出CSV
-
[1] HIRSCHFIELD GM, MASON A, LUKETIC V, et al. Efficacy of obeticholic acid in patients with primary biliary cirrhosis and inadequate response to ursodeoxycholic acid[J]. Gastroenterology, 2015, 148(4): 751-761. e8. DOI: 10.1053/j.gastro.2014.12.005. [2] LINDOR KD, BOWLUS CL, BOYER J, et al. Primary biliary cholangitis: 2018 practice guidance from the American Association for the Study of Liver Diseases[J]. Hepatology, 2019, 69(1): 394-419. DOI: 10.1002/hep.30145. [3] Chinese Society of Hepatology, Chinese Medical Association; Chinese Society of Gastroenterology, Chinese Medical Association; Chinese Socitety of infectious Diseases, Chinese Mdical Association. Consensus on the diagnosis and management of primary biliary cirrhosis(cholangitis) (2015)[J]. J Clin Hepatol, 2015, 31(12): 1980-1988. DOI: 10.3969/j.issn.1001-5256.2015.12.004.中华医学会肝病学分会, 中华医学会消化病学分会, 中华医学会感染病学分会. 原发性胆汁性肝硬化(又名原发性胆汁性胆管炎)诊断和治疗共识(2015)[J]. 临床肝胆病杂志, 2015, 31(12): 1980-1988. DOI: 10.3969/j.issn.1001-5256.2015.12.004. [4] CORPECHOT C, ABENAVOLI L, RABAHI N, et al. Biochemical response to ursodeoxycholic acid and long-term prognosis in primary biliary cirrhosis[J]. Hepatology, 2008, 48(3): 871-877. DOI: 10.1002/hep.22428. [5] CORPECHOT C, CHAZOUILLÈRES O, POUPON R. Early primary biliary cirrhosis: Biochemical response to treatment and prediction of long-term outcome[J]. J Hepatol, 2011, 55(6): 1361-1367. DOI: 10.1016/j.jhep.2011.02.031. [6] DICKSON ER, GRAMBSCH PM, FLEMING TR, et al. Prognosis in primary biliary cirrhosis: Model for decision making[J]. Hepatology, 1989, 10(1): 1-7. DOI: 10.1002/hep.1840100102. [7] LAMMERS WJ, HIRSCHFIELD GM, CORPECHOT C, et al. Development and validation of a scoring system to predict outcomes of patients with primary biliary cirrhosis receiving ursodeoxycholic acid therapy[J]. Gastroenterology, 2015, 149(7): 1804-1812. e4. DOI: 10.1053/j.gastro.2015.07.061. [8] CARBONE M, SHARP SJ, FLACK S, et al. The UK-PBC risk scores: Derivation and validation of a scoring system for long-term prediction of end-stage liver disease in primary biliary cholangitis[J]. Hepatology, 2016, 63(3): 930-950. DOI: 10.1002/hep.28017. [9] HUANG SS, MA X. The immunological and clinical significance of IgM in primary biliary cirrhosis[J]. Chin J Lab Med, 2013, 36(3): 201-205. DOI: 10.3760/cma.j.issn.1009-9158.2013.03.002.黄珊珊, 马雄. IgM在原发性胆汁性肝硬化中的免疫学意义及其临床应用[J]. 中华检验医学杂志, 2013, 36(3): 201-205. DOI: 10.3760/cma.j.issn.1009-9158.2013.03.002. [10] LIAN C, ZHAO Y, SUN J, et al. Role of cell autophagy in the generation of IgM and hepatic fibrosis in primary biliary cholangitis[J]. Clin Rheumatol, 2020, 39(11): 3499-3506. DOI: 10.1007/s10067-020-05111-6. [11] HAO J, LYU J, XING F, et al. Advances in drug therapy for primary biliary cholangitis[J]. J Clin Hepatol, 2020, 36(1): 222-226. DOI: 10.3969/j.issn.1001-5256.2020.01.053.郝娟, 吕靖, 邢枫, 等. 原发性胆汁性胆管炎的药物治疗进展[J]. 临床肝胆病杂志, 2020, 36(1): 222-226. DOI: 10.3969/j.issn.1001-5256.2020.01.053. [12] YANG N, TIAN SY, ZHANG M, et al. Effect of ursodeoxycholic acid combined with glucocorticoid in the treatment of primary biliary cholangitis with autoimmune hepatitis[J]. Med & Pharm J Chin PLA, 2021, 33(3): 72-77. DOI: 10.3969/j.issn.2095-140X.2021.03.016.杨宁, 田思远, 张苗, 等. 熊去氧胆酸联合糖皮质激素治疗伴自身免疫性肝炎特征原发性胆汁性胆管炎的效果分析[J]. 解放军医药杂志, 2021, 33(3): 72-77. DOI: 10.3969/j.issn.2095-140X.2021.03.016. [13] SMETS L, VERBEEK J, KORF H, et al. Improved markers of cholestatic liver injury in patients with primary biliary cholangitis treated with obeticholic acid and bezafibrate[J]. Hepatology, 2021, 73(6): 2598-2600. DOI: 10.1002/hep.31613. [14] KIKUCHI K, HSU W, HOSOYA N, et al. Ursodeoxycholic acid reduces CpG-induced IgM production in patients with primary biliary cirrhosis[J]. Hepatol Res, 2009, 39(5): 448-454. DOI: 10.1111/j.1872-034X.2008.00474.x. [15] TAKANO K, SAEKI C, OIKAWA T, et al. IgM response is a prognostic biomarker of primary biliary cholangitis treated with ursodeoxycholic acid and bezafibrate[J]. J Gastroenterol Hepatol, 2020, 35(4): 663-672. DOI: 10.1111/jgh.14900. [16] NAKAMURA M, KONDO H, TANAKA A, et al. Autoantibody status and histological variables influence biochemical response to treatment and long-term outcomes in Japanese patients with primary biliary cirrhosis[J]. Hepatol Res, 2015, 45(8): 846-855. DOI: 10.1111/hepr.12423. [17] ABE K, TAKAHASHI A, NOZAWA Y, et al. The utility of IgG, IgM, and CD138 immunohistochemistry in the evaluation of autoimmune liver diseases[J]. Med Mol Morphol, 2014, 47(3): 162-168. DOI: 10.1007/s00795-014-0082-z. [18] LUO Y, BRIGHAM D, BEDNAREK J, et al. Unique cholangiocyte-targeted IgM autoantibodies correlate with poor outcome in biliary atresia[J]. Hepatology, 2021, 73(5): 1855-1867. DOI: 10.1002/hep.31504. [19] YANG XL, ZHUANG L, HE HY, et al. Correlation between serum indexes and pathological stages in patients with PBC, and Logistic regression analysis on risk factors of patients with advanced PBC[J]. Chin J Gastroenterol Hepatol, 2019, 28(10): 1157-1161. DOI: 10.3969/j.issn.1006-5709.2019.10.014.杨晓玲, 庄琳, 和海玉, 等. PBC患者血清学指标与肝组织活检病理分期的关系及进展期PBC危险因素的Logistic回归分析[J]. 胃肠病学和肝病学杂志, 2019, 28(10): 1157-1161. DOI: 10.3969/j.issn.1006-5709.2019.10.014. [20] JOHN BV, KHAKOO NS, SCHWARTZ KB, et al. Ursodeoxycholic acid response is associated with reduced mortality in primary biliary cholangitis with compensated cirrhosis[J]. Am J Gastroenterol, 2021, 116(9): 1913-1923. DOI: 10.14309/ajg.0000000000001280. [21] GOET JC, MURILLO PEREZ CF, HARMS MH, et al. A comparison of prognostic scores (Mayo, UK-PBC, and GLOBE) in primary biliary cholangitis[J]. Am J Gastroenterol, 2021, 116(7): 1514-1522. DOI: 10.14309/ajg.0000000000001285. 期刊类型引用(7)
1. 张玉婷,李嘉泰,宋晓静,丁方回,岳平,闫少林,李俊峰,张立婷,李汛. 不同IgM水平的原发性胆汁性胆管炎患者治疗应答及预后特点分析. 胃肠病学和肝病学杂志. 2025(02): 250-253 .  百度学术
百度学术2. 张玲玲,张会品,李桂英,孔燕,马兰. 抗线粒体抗体、红细胞体积分布宽度与原发性胆汁性胆管炎熊去氧胆酸治疗应答效果的关系. 中国医药导报. 2024(04): 100-103 . 百度学术3. 张晓芳,徐海峰,章颖. LSM、PNI、Mayo评分对PBC相关肝硬化的预测价值. 南通大学学报(医学版). 2024(02): 131-135 . 百度学术4. 何学元,马建勋,杨屹立,张敏,潘新民. 布地奈德治疗熊去氧胆酸治疗不应答的原发性胆汁性胆管炎患者疗效及血清氧化应激指标的变化. 实用肝脏病杂志. 2023(03): 376-379 . 百度学术5. 邢雪梅,杨建睿,李治君,陈雅娟,姚凤霞,刘征. 免疫球蛋白用于原发性胆汁性胆管炎、戊型肝炎、肝硬化的鉴别诊断. 基础医学与临床. 2023(08): 1271-1274 . 百度学术6. 李兆明,章颖,邹美银. TBA、IgM、FIB-4评分对原发性胆汁性胆管炎患者肝纤维化的诊断价值. 胃肠病学和肝病学杂志. 2023(11): 1254-1257 . 百度学术7. 赵永春,刘锦云,刘晓瑞. 醋酸泼尼松龙联合熊去氧胆酸对PBC患者预后的影响. 河南医学高等专科学校学报. 2023(06): 637-640 . 百度学术其他类型引用(1)
-

 下载:
下载:


 百度学术
百度学术 本文二维码
本文二维码
计量
- 文章访问数: 822
- HTML全文浏览量: 212
- PDF下载量: 86
- 被引次数: 8