Value of magnetic resonance imaging-proton density fat fraction and FibroScan in quantitative evaluation of liver fat content in patients with chronic hepatitis B
-
摘要:
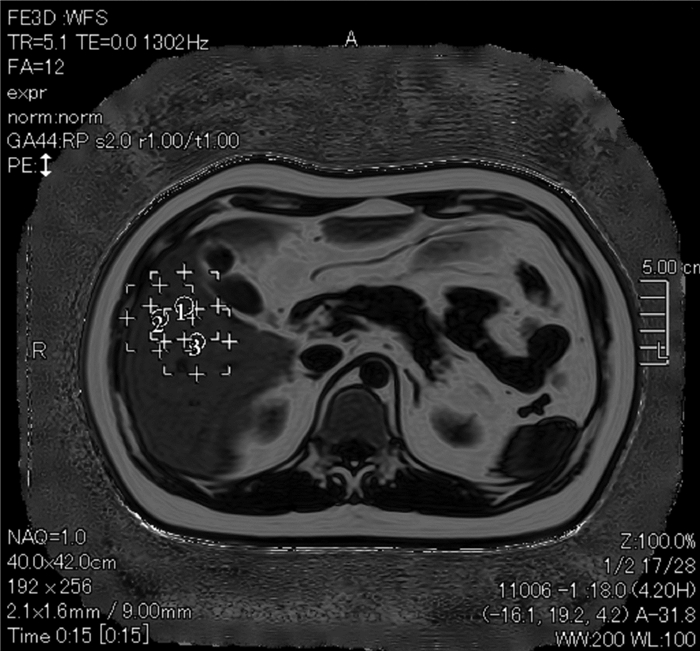
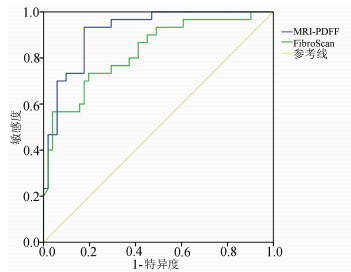
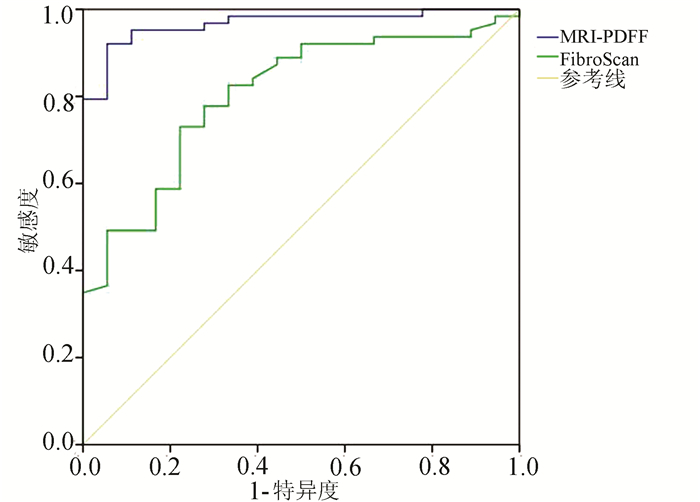
目的 探讨磁共振质子密度脂肪分数(MRI-PDFF)和瞬时弹性成像(FibroScan)定量评估慢性乙型肝炎(CHB)患者肝脂肪含量的价值。 方法 选取2017年2月—2020年7月于广州中医药大学第二临床医学院肝病科住院CHB患者96例,所有患者均接受肝组织病理检查确诊,并于术前完善MRI-PDFF、FibroScan检查。根据穿刺结果,将所有患者无脂肪肝(n=44)、轻度脂肪肝(n=33)及中重度脂肪肝(n=19)分组。符合正态分布的计量资料多组间比较采用单因素方差分析,进一步两两比较采用LSD-t法;不符合正态分布的计量资料多组间比较采用Kruskal-Wallis H检验,进一步两两比较采用Mann-Whitney U检验,并进行Bonferroni校正。采用受试者工作特征曲线(ROC曲线)分析HFF及CAP诊断脂肪肝的曲线下面积(AUC),获得敏感度、特异度和阈值。采用组内相关系数检验MRI-PDFF数据的一致性。 结果 中重度脂肪肝组MRI-PDFF HFF较无脂肪肝组、轻度脂肪肝组明显升高(P值均<0.05),轻度脂肪肝组MRI-PDFF HFF较无脂肪肝组明显升高(P<0.05)。中重度脂肪肝组FibroScan CAP较无脂肪肝组、轻度脂肪肝组均明显升高(P值均<0.05);轻度脂肪肝组FibroScan CAP较无脂肪肝组明显升高(P<0.05)。MRI-PDFF HFF诊断轻度脂肪肝的阈值为5.1%,AUC为0.901(P<0.001),敏感度为90.9%,特异度为82.7%;诊断中重度脂肪肝阈值为9.7%,AUC为0.972(P<0.001),敏感度为96.1%,特异度为89.5%。FibroScan CAP诊断轻度脂肪肝的阈值为258.5 dB/m,AUC为0.829(P<0.001),敏感度为77.3%,特异度为78.8%;诊断中重度脂肪肝阈值为285.5 dB/m,AUC为0.830(P<0.001),敏感度为76.6%,特异度为78.9%。 结论 MRI-PDFF、FibroScan能够客观评价CHB患者脂肪肝程度,MRI-PDFF HFF、FibroScan CAP可作为定量分析CHB合并肝脂肪变性的无创性标志物,并且MRI-PDFF HFF具有更高的诊断效能。 -
关键词:
- 乙型肝炎,慢性 /
- 脂肪肝 /
- 磁共振质子密度脂肪分数 /
- 弹性成像技术
Abstract:Objective To investigate the value of magnetic resonance imaging-proton density fat fraction (MRI-PDFF) and FibroScan in the quantitative evaluation of liver fat content in patients with chronic hepatitis B (CHB). Methods A total of 96 patients with CHB who were hospitalized in Department of Hepatology, The Second Clinical Medical College of Guangzhou University of Chinese Medicine, from February 2017 to July 2020 were enrolled, and all patients were diagnosed based on liver pathological examination. MRI-PDFF and FibroScan were performed before surgery. According to the results of liver biopsy, the patients were divided into non-fatty liver disease group with 44 patients, mild fatty liver disease group with 33 patients, and moderate-to-severe fatty liver disease group with 19 patients. A one-way analysis of variance was used for comparison of normally distributed continuous data between multiple groups, and the least significant difference t-test was used for further comparison between two groups; the Kruskal-Wallis H test was used for comparison of non-normally distributed continuous data between multiple groups, and the Mann-Whitney U test was used for further comparison between two groups; Bonferroni correction was also performed. The receiver operating characteristic (ROC) curve was plotted to analyze the area under the ROC curve (AUC) of hepatic fat fraction (HFF) and controllable attenuation parameters (CAP) in the diagnosis of fatty liver disease and obtain their sensitivities, specificities, and optimal cut-off values. The intraclass correlation coefficient was used to investigate the consistency of MRI-PDFF data. Results The moderate-to-severe fatty liver disease group had a significant increase in MRI-PDFF HFF compared with the non-fatty liver disease group and the mild fatty liver disease group (all P < 0.05), and the mild fatty liver disease group had a significant increase in MRI-PDFF HFF compared with the non-fatty liver disease group(P < 0.05). The moderate-to-severe fatty liver disease group had a significant increase in FibroScan CAP compared with the non-fatty liver disease group and the mild fatty liver disease group (all P < 0.05), and the mild fatty liver disease group had a significant increase in FibroScan CAP compared with the non-fatty liver disease group (P < 0.05). In the diagnosis of mild fatty liver disease, MRI-PDFF HFF had an AUC of 0.901 (P < 0.001), a sensitivity of 90.9%, and a specificity of 82.7% at the optimal cut-off value of 5.1%, and in the diagnosis of moderate-to-severe fatty liver disease, MRI-PDFF HFF had an AUC of 0.972 (P < 0.001), a sensitivity of 96.1%, and a specificity of 89.5% at the optimal cut-off value of 9.7%. In the diagnosis of mild fatty liver disease, FibroScan CAP had an AUC of 0.829 (P < 0.001), a sensitivity of 77.3%, and a specificity of 78.8% at the optimal cut-off value of 258.5 dB/m, and in the diagnosis of moderate-to-severe fatty liver disease, FibroScan CAP had an AUC of 0.830 (P < 0.001), a sensitivity of 76.6%, and a specificity of 78.9% at the optimal cut-off value of 285.5 dB/m. Conclusion Both MRI-PDFF and FibroScan can objectively evaluate the degree of fatty liver disease in patients with CHB. MRI-PDFF HFF and FibroScan CAP can be used as noninvasive markers for the quantitative analysis of CHB with hepatic steatosis, and MRI-PDFF HFF tends to have higher diagnostic efficiency. -
表 1 各级脂肪肝组MRI-PDFF HFF、FibroScan CAP比较
组别 例数 MRI-PDFF HFF FibroScan CAP 无脂肪肝组 44 3.78(3.37~4.73) 231.16±45.27 轻度脂肪肝组 33 5.67(4.60~7.06)1) 279.15±42.641) 中重度脂肪肝组 19 17.91(11.12~22.71)1)2) 316.31±39.411)2) 统计值 H=59.99 F=28.56 P值 <0.001 <0.001 注:与无脂肪肝组比较,1) P<0.05;与轻度脂肪肝组比较,2)P<0.05。 表 2 MRI-PDFF HFF一致性检验结果
项目 组内相关性 95%CI 使用Ture值0进行F值测试 数值 df1 df2 显著性 单一测量 0.981 0.972~0.988 108.126 95 95 <0.001 平均值测量 0.991 0.986~0.994 108.126 95 95 <0.001 -
[1] Chinese Society of Infectious Diseases, Chinese Medical Association, Chinese Society of Hepatology, Chinese Medical Association. Guidelines for the prevention and treatment of chronic hepatitis B (version 2019)[J]. J Clin Hepatol, 2019, 35(12): 2648-2669. DOI: 10.3969/j.issn.1001-5256.2019.12.007.中华医学会感染病学分会, 中华医学会肝病学分会. 慢性乙型肝炎防治指南(2019年版)[J]. 临床肝胆病杂志, 2019, 35(12): 2648-2669. DOI: 10.3969/j.issn.1001-5256.2019.12.007. [2] YE J, WANG W, FENG S, et al. Precise fibrosis staging with shear wave elastography in chronic hepatitis B depends on liver inflammation and steatosis[J]. Hepatol Int, 2020, 14(2): 190-201. DOI: 10.1007/s12072-020-10017-1. [3] CHANG JW, LEE HW, KIM BK, et al. Hepatic steatosis index in the detection of fatty liver in patients with chronic hepatitis B receiving antiviral therapy[J]. Gut Liver, 2021, 15(1): 117-127. DOI: 10.5009/gnl19301. [4] CHEN YC, JENG WJ, HSU CW, et al. Impact of hepatic steatosis on treatment response in nuclesos(t)ide analogue-treated HBeAg-positive chronic hepatitis B: A retrospective study[J]. BMC Gastroenterol, 2020, 20(1): 146. DOI: 10.1186/s12876-020-01289-w. [5] GUO Z, BLAKE GM, LI K, et al. Liver fat content measurement with quantitative CT validated against MRI proton density fat fraction: A prospective study of 400 healthy volunteers[J]. Radiology, 2020, 294(1): 89-97. DOI: 10.1148/radiol.2019190467. [6] GANDHA N, WIBAWA LP, JACOEB T, et al. Correlation between psoriasis severity and nonalcoholic fatty liver disease degree measured using controlled attenuation parameter[J]. Psoriasis (Auckl), 2020, 10: 39-44. DOI: 10.2147/PTT.S272286. [7] MA LX, ZHANG YH, SU BL. Evaluation of liver steatosis and fibrosis in patients of type 2 diabetes mellitus and correlation between liver steatosis and fibrosis by FibroTouch technique[J]. J Chin Clin Med Imaging, 2018, 29(9): 636-639. DOI: 10.12117/jccmi.2018.09.008.马丽雪, 张宇虹, 苏本利. 应用FibroTouch技术评价2型糖尿病患者肝脏脂肪变和纤维化程度及二者相关性[J]. 中国临床医学影像杂志, 2018, 29(9): 636-639. DOI: 10.12117/jccmi.2018.09.008. [8] VITEL A, SPOREA I, MARE R, et al. Association between subclinical left ventricular myocardial systolic dysfunction detected by strain and strain-rate imaging and liver steatosis and fibrosis detected by elastography and controlled attenuation parameter in patients with metabolic syndrome[J]. Diabetes Metab Syndr Obes, 2020, 13: 3749-3759. DOI: 10.2147/DMSO.S268916. [9] GU Q, CEN L, LAI J, et al. A meta-analysis on the diagnostic performance of magnetic resonance imaging and transient elastography in nonalcoholic fatty liver disease[J]. Eur J Clin Invest, 2021, 51(2): e13446. DOI: 10.1111/eci.13446. [10] OEDA S, TANAKA K, OSHIMA A, et al. Diagnostic accuracy of fibroscan and factors affecting measurements[J]. Diagnostics (Basel), 2020, 10(11): 940. DOI: 10.3390/diagnostics10110940. [11] YANG YM, LIU YP, ZHOU DJ, et al. Values of 3.0T MRI PDFF and IP-OP in quantificative evaluation on fatty liver[J]. J Jilin Univ(Med Edit), 2020, 46(4): 875-880. DOI: 10.13481/j.1671-587x.20200434.杨逸铭, 刘玉品, 周懂晶, 等. 3.0T MRI PDFF和IP-OP对脂肪肝定量评估的价值[J]. 吉林大学学报(医学版), 2020, 46(4): 875-880. DOI: 10.13481/j.1671-587x.20200434. [12] ZHOU DJ, HUANG LX, LIU YP, et al. Value of fatty liver disease by 3.0 T magnetic resonance IDEAL-IQ sequence: A quantitative assessment[J]. Chin J Biomed Eng, 2017, 23(1): 55-58. DOI: 10.3760/cma.j.issn.1674-1927.2017.01.013.周懂晶, 黄丽霞, 刘玉品, 等. 3.0 T磁共振IDEAL-IQ技术定量评估脂肪肝的价值[J]. 中华生物医学工程杂志, 2017, 23(1): 55-58. DOI: 10.3760/cma.j.issn.1674-1927.2017.01.013. [13] YE J, WU Y, LI F, et al. Effect of orlistat on liver fat content in patients with nonalcoholic fatty liver disease with obesity: Assessment using magnetic resonance imaging-derived proton density fat fraction[J]. Therap Adv Gastroenterol, 2019, 12: 1756284819879047. DOI: 10.1177/1756284819879047. [14] ZHAO S, LIU MW, LIU SF, et al. IDEAL-IQ and CT quantitative analysis for accurate quantitative fat content in nonalcoholic fatty liver disease[J]. J Med Imaging, 2019, 29(12): 2162-2166. DOI: 1006-9011(2019) 12-2162-04.赵森, 刘梦雯, 刘双锋, 等. 磁共振IDEAL-IQ技术和CT定量分析在非酒精性脂肪肝病的临床应用[J]. 医学影像学杂志, 2019, 29(12): 2162-2166. DOI: 1006-9011(2019) 12-2162-04. [15] GU Q, CEN L, LAI J, et al. A meta-analysis on the diagnostic performance of magnetic resonance imaging and transient elastography in nonalcoholic fatty liver disease[J]. Eur J Clin Invest, 2021, 51(2): e13446. DOI: 10.1111/eci.13446. 期刊类型引用(5)
1. 王耀磊,王盼攀. 肝门部胆管癌患者术后并发症发生情况及其影响因素的Logistic回归分析. 医学理论与实践. 2024(11): 1822-1825 .  百度学术
百度学术2. 李明,于群,肖熙,刘影倩,黄裕存. 外科Apgar评分及POSSUM评分对老年严重胸部外伤术后预后的评估价值. 名医. 2023(09): 30-32 .  百度学术
百度学术3. 朱磊,赵海淳,李珊珊,孟君. 外科Apgar评分对术前新辅助化疗进展期胃癌术后并发症的预测价值. 中国现代普通外科进展. 2022(12): 990-993 .  百度学术
百度学术4. 章周海,涂从银. 肝门部胆管癌的手术疗效分析. 肝胆外科杂志. 2021(03): 223-225 .  百度学术
百度学术5. 遆军锋,温陈,张小云,姜丹丹. 肝门部胆管癌术后并发症发生危险因素及术前外科改良 Apgar评分、血清总胆红素水平对并发症的预测价值. 陕西医学杂志. 2021(12): 1513-1516 .  百度学术
百度学术其他类型引用(0)
-


 PDF下载 ( 2431 KB)


 下载:
下载:


 百度学术
百度学术

