核苷(酸)类似物初治的慢性乙型肝炎患者发生低病毒血症的影响因素及其动态变化分析
DOI: 10.3969/j.issn.1001-5256.2022.12.008
Influencing factors for low-level viremia and their dynamic changes in patients with chronic hepatitis B treated with nucleos(t)ide analogues for the first time
-
摘要:
目的 探讨核苷(酸)类似物(NAs)初治的慢性乙型肝炎(CHB)患者发生低病毒血症(LLV)的影响因素,并进一步分析其动态变化。 方法 选取2020年11月—2022年3月于南昌大学第一附属医院感染科门诊就诊且接受NAs抗病毒治疗至少12个月的CHB患者78例,根据治疗期间的HBV DNA水平,将患者分为持续病毒学应答(SVR)组(n=58)和LLV组(n=20)。计量资料两组间比较采用独立样本t检验或Mann -Whitney U检验,计数资料两组间比较采用χ2检验或Fisher精确检验;多因素Logistic回归分析CHB患者发生LLV的独立影响因素,并建立预测模型。采用受试者工作特征曲线(ROC曲线)评价模型的预测价值。使用Kaplan-Meier分析HBV DNA累积阴转率,应用Log-rank检验进行比较。采用重复测量方差分析比较两组间或组内0、12、24、36、48周HBV DNA和HBsAg水平及其变化的差异。 结果 LLV组HBeAg阳性率(90.0% vs 48.3%,χ2=10.701,P=0.001)、HBV DNA log值(7.26±1.46 vs 5.65±1.70,t=-4.178,P<0.001)、HBsAg log值(4.53±0.86 vs 3.44±0.93,t=-4.813,P<0.001)高于SVR组,年龄[29(26~34)岁vs 33(30~43)岁,Z=-2.751,P=0.009]、ALT[67.0(54.0~122.0)U/L vs 111.0(47.0~406.0)U/L,Z=-2.203,P=0.028]、AST[43.5(32.8~62.8)U/L vs 77.5(35.0~213.0)U/L,Z=-2.466,P=0.014]、LSM[7.7(6.3~8.5)kPa vs 8.9(7.2~11.4)kPa,Z=-2.022,P=0.043]低于SVR组。多因素Logistic回归分析显示,基线HBV DNA(OR=2.365,95%CI: 1.220~4.587,P=0.011)、HBsAg(OR=4.229,95%CI: 1.098~16.287,P=0.036)和ALT(OR=0.965,95%CI: 0.937~0.994,P=0.018)是CHB患者发生LLV的独立影响因素;由此建立预测模型Logit(MLLV)=-8.668+1.441×lgHBsAg+0.598×lgHBV DNA-0.016×ALT,其ROC曲线下面积为0.931,高于HBV DNA、HBsAg和ALT(ROC曲线下面积分别为0.774、0.856、0.666),最佳截断值为0.44,敏感度、特异度分别为85.00%、93.10%。基线HBV DNA>7.29 lgIU/mL和HBsAg>4.38 lgIU/mL的CHB患者HBV DNA阴转率明显低于HBV DNA≤7.29 lgIU/mL和HBsAg≤4.38 lgIU/mL的患者(χ2值分别为22.52、26.35,P值均<0.001)。CHB患者的HBV DNA和HBsAg的下降速率分别在第12周和第24周最大,LLV组患者HBV DNA和HBsAg水平在0、12、24、36、48周均高于SVR组(HBV DNA:t值分别为-4.084、-4.526、-5.688、-7.123、-6.266,P值均<0.001;HBsAg:t值分别为-4.652、-4.691、-4.952、-4.804、-4.407,P值均<0.001)。 结论 基线高HBV DNA水平、HBsAg定量和低ALT水平的NAs初治CHB患者更易发生LLV,动态监测其变化对LLV的出现有重要意义。 Abstract:Objective To investigate the influencing factors for low-level viremia (LLV) and their dynamic changes in chronic hepatitis B (CHB) patients treated with nucleos(t)ide analogues (NAs) for the first time. Methods A retrospective analysis was performed for 78 CHB patients who attended Department of Infectious Diseases, The First Affiliated Hospital of Nanchang University, from November 2020 to March 2022 and received antiviral therapy with NAs for at least 12 months, and according to HBV DNA level during treatment, they were divided into sustained virologic response (SVR) group with 58 patients and LLV group with 20 patients. The independent samples t-test or the Mann-Whitney U test was used for comparison of continuous data between two groups, and the chi-square test or the Fisher's exact test was used for comparison of categorical data between two groups. The multivariate Logistic regression analysis was used to investigate the independent influencing factors for LLV and establish a predictive model, and the receiver operating characteristic (ROC) curve was used to evaluate the predictive value of this model. The Kaplan-Meier method was used to analyze cumulative HBV DNA negative conversion rate, and the Log-rank test was used for comparison. The analysis of variance with repeated measures was used to analyze the differences in HBV DNA and HBsAg between the two groups or within each group at weeks 0, 12, 24, 36, and 48. Results Compare with the SVR group, the LLV group had significantly higher HBeAg positive rate (90.0% vs 48.3%, χ2=10.701, P=0.001), log(HBV DNA) value (7.26±1.46 vs 5.65±1.70, t=-4.178, P < 0.001), and log(HBsAg) value (4.53±0.86 vs 3.44±0.93, t=-4.813, P < 0.001) and significantly lower age [29 (26-34) vs 33 (30-43), Z=-2.751, P=0.009], alanine aminotransferase (ALT) [67.0 (54.0-122.0)U/L vs 111.0 (47.0-406.0)U/L, Z=-2.203, P=0.028], aspartate aminotransferase [43.5 (32.8-62.8) U/L vs 77.5 (35.0-213.0)U/L, Z=-2.466, P=0.014], and liver stiffness measurement [7.7 (6.3-8.5)kPa vs 8.9 (7.2-11.4)kPa, Z=-2.022, P=0.043]. The multivariate logistic regression analysis showed that baseline HBV DNA (odds ratio [OR]=2.365, 95% confidence interval [CI]: 1.220-4.587, P=0.011), HBsAg (OR=4.229, 95% CI: 1.098-16.287, P=0.036), and ALT (OR=0.965, 95% CI: 0.937-0.994, P=0.018) were independent influencing factors for LLV in CHB patients, and the predictive model of Logit(MLLV)=-8.668+1.441×lgHBsAg+0.598×lgHBV DNA-0.016×ALT was established based on these factors, which had a larger area under the ROC curve than HBV DNA, HBsAg, and ALT (0.931 vs 0.774/0.856/0.666), with a sensitivity of 85.00% and a specificity of 93.10% at the optimal cut-off value of 0.44. The CHB patients with baseline HBV DNA > 7.29 lgIU/mL or HBsAg > 4.38 lgIU/mL had a significantly lower DNA negative conversion rate than those with DNA ≤7.29 lgIU/mL or HBsAg ≤4.38 lgIU/mL (χ2=22.52 and 26.35, both P < 0.001). In the CHB patients, the highest reduction rates of HBV DNA and HBsAg were observed at weeks 12 and 24, respectively, and the LLV group had significantly higher levels of HBV DNA and HBsAg than the SVR group at weeks 0, 12, 24, 36, and 48 (HBV DNA: t=-4.084, -4.526, -5.688, -7.123, and -6.266, all P < 0.001; HBsAg: t=-4.652, -4.691, -4.952, -4.804, and -4.407, all P < 0.001). Conclusion For the CHB patients treated with NAs for the first time, those with high HBV DNA load, high HBsAg quantification, and low ALT level at baseline are more likely to develop LLV, and dynamic monitoring of these indices is of great significance to observe the onset of LLV. -
Key words:
- Hepatitis B, Chronic /
- Low-level Viremia /
- Forecasting
-
慢性乙型肝炎(CHB)是由HBV持续感染引起的肝脏慢性炎症性疾病。全世界约有2.57亿人感染HBV[1],我国HBV感染者高达普通人群的10%[2],而CHB患者约有3000万人[3]。因此,CHB仍是我国乃至全球肝脏疾病相关死亡率的主要原因。抗病毒治疗是CHB的核心治疗,核苷(酸)类似物(NAs)抗病毒效果强、服用方便且不良反应少,在临床上被广泛应用,但因其不能直接作用于肝细胞核内的共价闭合环状DNA(cccDNA),导致HBV感染难以完全治愈。随着HBV DNA检测灵敏度不断的提高,许多既往认为获得持续病毒学应答(SVR)的患者经高敏HBV DNA检测后发现血清HBV DNA呈低水平复制,即低病毒血症(low-level viremia,LLV)。现有的研究[4-7]发现,LLV可引起耐药、病毒学突破,甚至与肝纤维化、肝硬化以及肝癌的发生发展相关。目前关于LLV预测模型及HBV血清学标志物的动态变化研究较少。本研究旨在通过回顾性分析NAs初治的CHB患者的临床资料,明确LLV发生的影响因素以及治疗期间患者的血清病毒学指标动态变化。
1. 资料与方法
1.1 研究对象
回顾性分析2020年11月—2022年3月在南昌大学第一附属医院感染科门诊就诊的CHB患者。纳入标准:所有CHB患者符合《慢性乙型肝炎防治指南(2019版)》[8];接受一线NAs抗病毒治疗至少12个月;基线HBV DNA≥2000 IU/mL。排除标准:同时合并其他类型肝炎病毒、HIV、EB病毒等;合并自身免疫性疾病、恶性肿瘤、严重基础疾病等;至2022年3月,HBV DNA≥2000 IU/mL的患者;依从性差的患者;HBV耐药突变的患者;基线资料或动态资料不全的患者。
1.2 研究方法
根据CHB患者治疗期间的HBV DNA水平,将患者分为SVR组和LLV组。SVR组的定义是在达到了完全病毒学应答后,HBV DNA持续检测不到(<20 IU/mL);LLV组的定义为接受一线抗病毒药物治疗至少48周,患者血清HBV DNA持续性或间歇性可检测到(≥20 IU/mL,但<2000 IU/mL)[9]。
1.3 观察指标
收集患者的一般资料,包括性别、年龄、BMI、家族史、有无肝硬化、有无代谢相关性脂肪性肝病(MAFLD);NAs类型包括恩替卡韦(ETV)、富马酸替诺福韦(TDF)和富马酸丙酚替诺福韦(TAF);实验室指标:基线及12、24、36及48周HBV DNA、HBsAg定量等HBV血清学标志物、肝肾功能、血常规;影像学指标:腹部彩超、LSM等。高敏HBV DNA定量检测采用TaqMan实时荧光定量PCR(仪器:美国罗氏480实时荧光定量PCR仪),检测下限为20 IU/mL。血清HBV标志物采用的是美国雅培公司Abbott ARCHITECT仪器及试剂分析。血常规、血生化等指标均在南昌大学第一附属医院检验科完成。
1.4 统计学方法
采用SPSS 26.0和MedCalc 20.0软件进行数据统计处理,Graphpad Prism 8.0软件进行绘图。符合正态分布的计量资料采用x±s表示,两组间比较采用独立样本t检验;非正态分布的计量资料用M(P25~P75)表示,两组间比较采用Mann-Whitney U检验。计数资料两组间比较采用χ2检验或Fisher精确检验。多因素二元Logistic回归分析CHB患者发生LLV的独立影响因素,并建立预测模型,采用Hosmer-Lemeshow检验评估模型的拟合度,运用受试者工作特征曲线(ROC曲线)并计算曲线下面积(AUC)评估相关因素及模型对CHB患者发生LLV的预测价值。采用Kaplan-Meier分析HBV DNA累积阴转率,应用Log-rank检验进行比较。采用重复测量资料方差分析比较两组间或组内0、12、24、36、48周HBV DNA和HBsAg水平及其变化的差异。HBV DNA及HBsAg定量进行lg转化。P<0.05为差异具有统计学意义。
2. 结果
2.1 一般资料
本研究共纳入CHB患者78例,SVR组58例(74.4%),LLV组20例(25.6%)。患者多为男性(69.2%),年龄29~39岁,中位年龄32岁。LLV组HBeAg阳性率、HBV DNA、HBsAg水平高于SVR组,年龄、ALT、AST、LSM低于SVR组,差异均具有统计学意义(P值均<0.05)(表 1)。
表 1 CHB患者基线临床特征和实验室指标分析Table 1. Analysis of baseline clinical characteristics and laboratory indexes of CHB patients项目 所有患者(n=78) SVR组(n=58) LLV组(n=20) 统计值 P值 年龄(岁) 32(29~39) 33(30~43) 29(26~34) Z=-2.751 0.009 男性[例(%)] 54(69.2) 40(68.9) 14(70.0) χ2=0.007 0.931 家族史[例(%)] 22(28.2) 16(27.6) 6(30.0) χ2=0.043 0.836 BMI(kg/m2) 23.3±3.7 23.7±4.0 22.3±2.5 t=1.359 0.164 HBeAg阳性[例(%)] 46(59.0) 28(48.3) 18(90.0) χ2=10.701 0.001 lgHBV DNA(IU/mL) 6.07±1.78 5.65±1.70 7.26±1.46 t=-4.178 <0.001 lgHBsAg(IU/mL) 3.72±1.02 3.44±0.93 4.53±0.86 t=-4.813 <0.001 抗-HBc 8.50(7.51~9.83) 8.56(7.65~9.80) 8.46(6.91~9.87) Z=-0.092 0.927 AST(U/L) 68.0(38.5~125.5) 77.5(35.0~213.0) 43.5(32.8~62.8) Z=-2.466 0.014 ALT(U/L) 105.0(53.4~218.0) 111.0(47.0~406.0) 67.0(54.0~122.0) Z=-2.203 0.028 TBil(μmol/L) 15.6(10.2~32.5) 17.0(11.2~36.6) 15.0(9.3~20.7) Z=-1.087 0.277 Alb(g/L) 44.5(40.2~46.9) 43.6(38.4~46.5) 46.3(42.7~48.5) Z=2.352 0.073 TG(mmol/L) 1.00(0.63~1.44) 1.03(0.62~1.57) 0.96(0.76~13.20) Z=-0.069 0.945 Cr(μmol/L) 65.6(56.7~76.4) 62.3(54.9~73.5) 68.2(56.1~71.9) Z=2.432 0.065 PLT(×109) 181.7±65.9 174.3±67.3 202.7±58.4 t=-1.769 0.067 LSM(kPa) 8.1(6.8~11.2) 8.9(7.2~11.4) 7.7(6.3~8.5) Z=-2.022 0.043 肝硬化[例(%)] 25(32.1) 20(34.5) 5(25.0) χ2=0.614 0.433 抗病毒药物类型[例(%)] χ2=1.345 0.246 ETV初治 66(84.6) 49(84.5) 17(85.0) TDF或TAF初治 12(15.4) 9(15.5) 3(15.0) MAFLD[例(%)] 17(21.8) 13(22.4) 4(20.0) χ2=0.051 0.822 2.2 CHB患者发生LLV多因素分析及预测模型建立
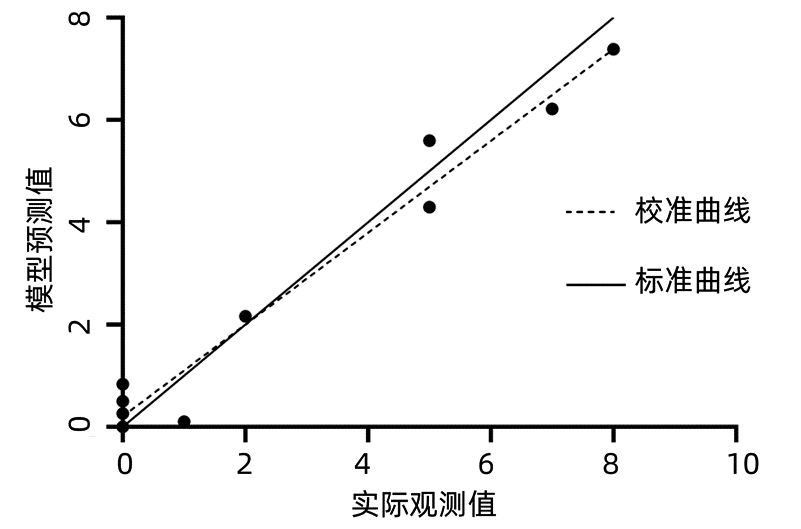
将单因素分析(表 1)中差异具有统计学意义的指标纳入多因素Logistic回归分析,使用BOX-Tidwell方法检验自变量与因变量的logit转换值之间是否存在线性关系,运用容忍度、方差膨胀因子检验自变量之间的多重共线性,结果显示容差值均0.1~1.0,VIF值均<10,表明所纳入的自变量之间不存在共线性。多因素Logistic回归分析结果显示,基线HBV DNA(OR=2.365,95%CI: 1.220~4.587,P=0.011)、基线HBsAg(OR=4.229,95%CI: 1.098~16.287,P=0.036)是影响CHB患者发生LLV的独立危险因素,而ALT(OR=0.965,95%CI: 0.937~0.994,P=0.018)是独立保护性因素。根据多因素分析结果,将HBV DNA、HBsAg和ALT再次行二元Logistics回归分析,根据回归系数作为危险因素的权重(表 2),建立CHB患者发生LLV的预测模型(MLLV),计算公式为:Logit(MLLV)=-8.668+1.441×lgHBsAg+0.598×lgHBV DNA-0.016×ALT,LLV发生概率P=elogit(MLLV)/(1+ elogit(MLLV))。回归模型系数的综合检验结果显示P<0.001,采用Hosmer-Lemeshow检验,结果显示χ2=11.625,P=0.169,表明模型与观察值拟合度较好(图 1)。
表 2 MLLV模型的建立Table 2. Establishment of the MLLV model变量 B值 SE Wald OR 95%CI P值 lgHBV DNA 0.589 0.245 5.932 1.818 1.124~2.942 0.015 lgHBsAg 1.441 0.586 6.051 4.225 1.340~13.316 0.014 ALT -0.016 0.007 4.918 0.984 0.969~0.998 0.027 常数 -8.668 2.355 13.551 0.001 <0.001 2.3 MLLV模型预测价值的分析
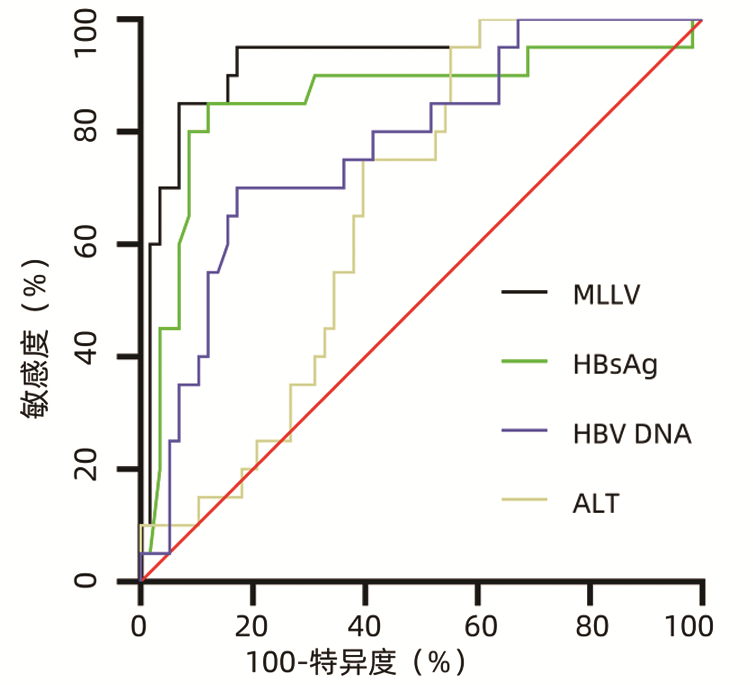
通过绘制HBV DNA、HBsAg、ALT和MLLV模型的ROC曲线,分析各指标和模型的预测价值(表 3,图 2)。结果显示,MLLV模型预测CHB患者发生LLV的AUC值明显大于HBV DNA、HBsAg、ATL单独预测的AUC值。MLLV模型的最佳截断值为0.44,对应的敏感度为85.00%,特异度为93.10%,AUC值为0.931,95%CI为0.850~0.976,提示该模型具有较好的预测效能(P<0.001)。
表 3 HBV DNA、HBsAg、ALT和MLLV对LLV发生的预测价值Table 3. Predictive value of HBV DNA, HBsAg, ALT and MLLV for the occurrence of LLV指标 AUC 95%CI 截断值 敏感度 特异度 P值 HBV DNA 0.774 0.665~0.861 7.29 70.00% 82.76% <0.001 HBsAg 0.856 0.758~0.925 4.38 85.00% 87.93% <0.001 ALT 0.666 0.550~0.769 139.80 95.00% 44.83% 0.007 MLLV 0.931 0.850~0.976 0.44 85.00% 93.10% <0.001 2.4 不同基线HBV DNA和HBsAg的CHB患者DNA累积阴转率
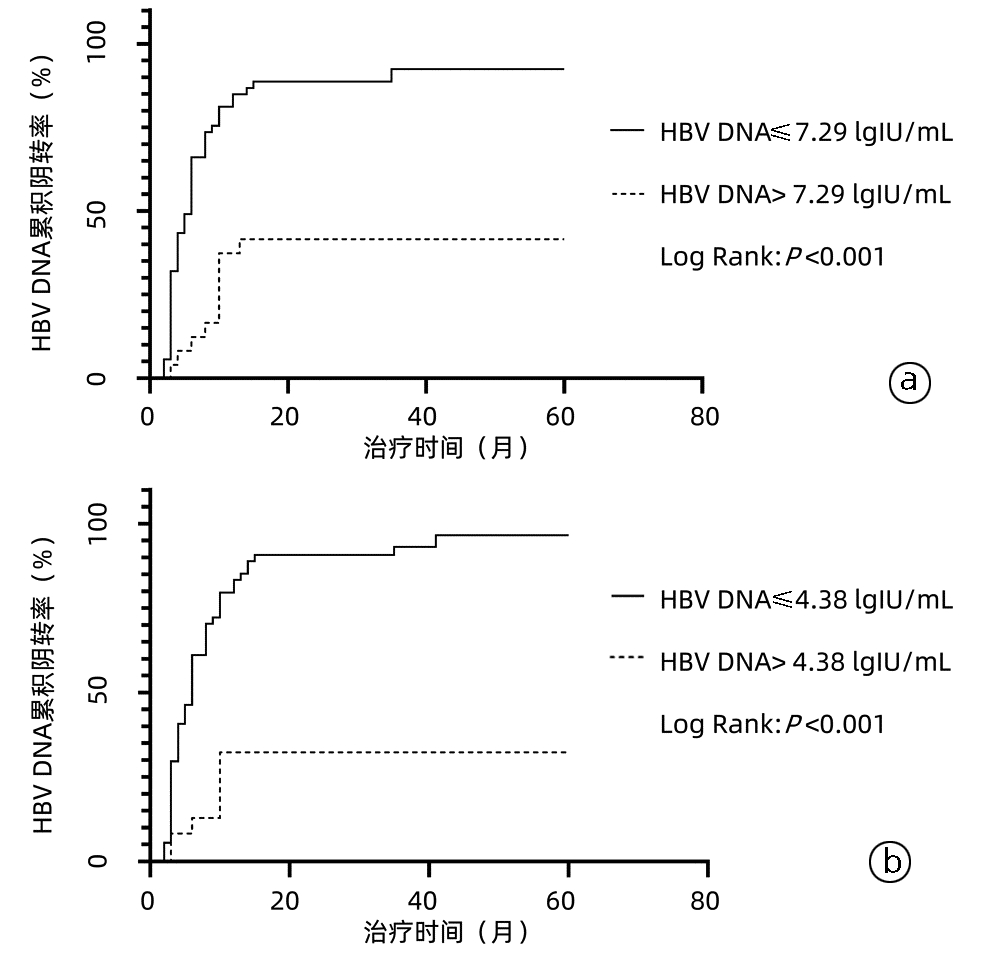
根据基线HBV DNA的截断值(表 3)将患者分为HBV DNA>7.29 lgIU/mL组和HBV DNA≤7.29 lgIU/mL组,进一步使用二元Logistic回归分析,结果提示基线HBV DNA>7.29 lgIU/mL的患者LLV的发生风险是基线HBV DNA≤7.29 lgIU/mL患者的8.944倍(P<0.001);同样对根据HBsAg截断值分组的患者进行分析,发现HBsAg>4.38 lgIU/mL患者LLV的发生风险是HBsAg≤4.38 lgIU/mL患者的35.417倍(P<0.001)。进一步使用Kaplan-Meier曲线分析不同基线HBV DNA的CHB患者的HBV DNA累积阴转率,发现随着治疗时间的延长,两组患者HBV DNA的阴转率逐渐提高,但基线HBV DNA<7.29 lgIU/mL组患者HBV DNA阴转率始终高于另一组(χ2=22.52,P<0.001)(图 3a);同样使用Kaplan-Meier曲线分析不同基线HBsAg的CHB患者HBV DNA的累积阴转率,结果显示,基线HBsAg≤4.38 lgIU/mL组患者HBV DNA阴转率始终高于另一组(χ2=26.35,P<0.001)(图 3b)。
2.5 治疗期间HBV DNA、HBsAg动态变化分析
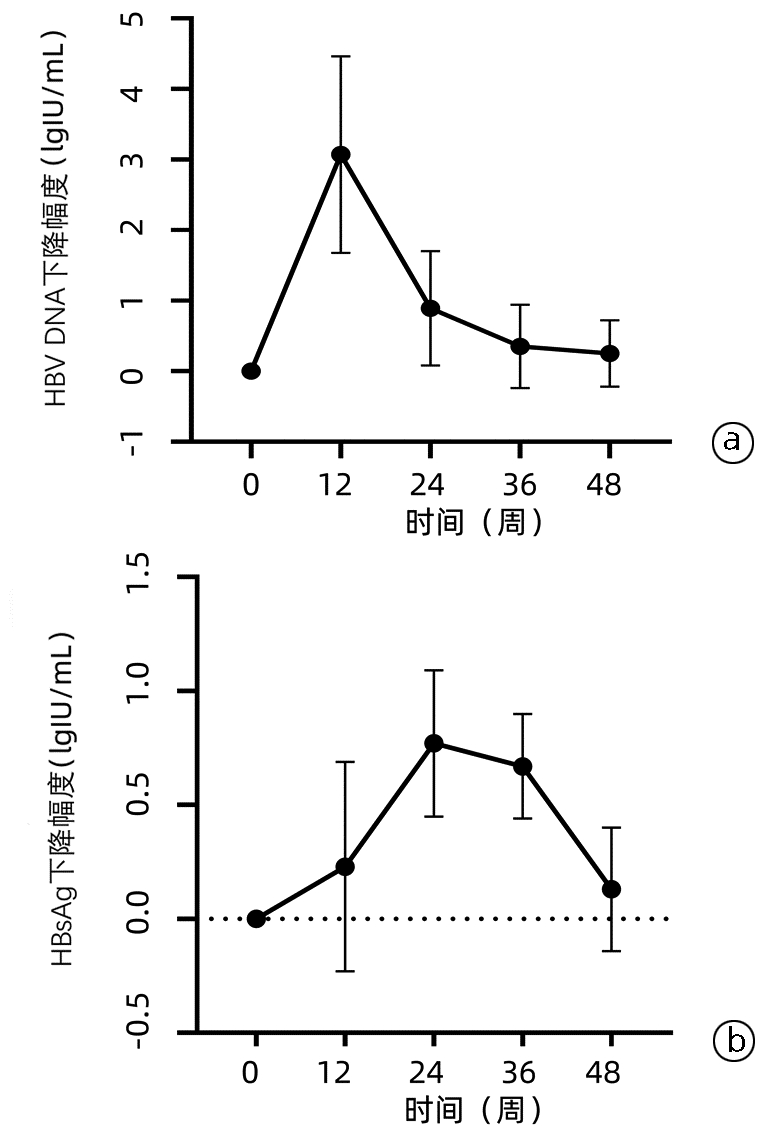
CHB患者治疗期间HBV DNA、HBsAg水平均逐渐下降(图 4),呈先快后慢的趋势,HBV DNA在第12周下降幅度最大[(3.07±1.39)lgIU/mL],在治疗12周后下降幅度逐渐减小(图 5a),而HBsAg在第24周下降幅度最大[(0.77±0.32)lgIU/mL](图 5b)。
LLV组和SVR组患者随着治疗时间的延长,HBV DNA和HBsAg水平均持续下降,组内比较差异均具有统计学意义(P值均<0.05)(表 4),且LLV组患者在治疗基线、12周、24周、36周、48周时的HBV DNA和HBsAg水平始终高于SVR组(P值均<0.05)。LLV组在第12周和第24周时的HBV DNA下降幅度分别为(3.27±1.07)lgIU/mL、(4.41±1.36)lgIU/mL,而SVR组第12周和第24周时的HBV DNA下降幅度分别为(3.01±1.49)lgIU/mL、(3.80± 1.49)lgIU/mL,差异均无统计学意义(P值均>0.05)。对两组在第12周和第24周的HBsAg下降幅度进行分析,发现差异均无统计学意义(P值均>0.05)。
表 4 CHB患者治疗期间HBV DNA和HBsAg动态变化Table 4. Dynamic changes of HBV DNA level and HBsAg level in CHB patients during treatment时间 SVR组(n=58) LLV组 (n=20) t值 P值 HBV DNA(lgIU/mL) 基线 5.62±1.69 7.35±1.44 -4.084 <0.001 12周 2.62±1.261) 4.08±1.221) -4.526 <0.001 24周 1.82±0.731) 2.99±0.861) -5.688 <0.001 36周 1.43±0.371) 2.73±0.791) -7.123 <0.001 48周 1.28±0.341) 2.19±0.651) -6.266 <0.001 HBsAg(lgIU/mL) 基线 3.44±0.92 4.53±0.86 -4.652 <0.001 12周 3.23±0.801) 4.22±0.871) -4.691 <0.001 24周 3.16±0.701) 4.11±0.831) -4.952 <0.001 36周 3.12±0.661) 3.98±0.771) -4.804 <0.001 48周 3.00±0.691) 3.81±0.771) -4.407 <0.001 注:与同组基线比较,1)P<0.05。 3. 讨论
HBV感染是我国终末期肝病发生的主要原因,而口服NAs仍是抗病毒治疗的主要方法,一些具有强效抑制病毒和低耐药的药物,如ETV、TDF、TAF,已被推荐为一线用药[10-11]。然而,随着核酸检测技术的不断进步,HBV DNA的检测下限逐渐被突破,越来越多的患者在抗病毒治疗过程中检测到HBV DNA呈低水平复制。日本学者[12]研究发现经ETV治疗48周的CHB患者,约19.9%的患者HBV DNA阳性,而TDF和TAF单药治疗的患者HBV DNA阳性率分别为21.2%和21.5%[13]。其他真实世界的研究表明,即使是使用一线抗病毒药物,仍有20%~40%的患者会发生LLV[6, 14-15],本研究中CHB患者的LLV发生率为25.6%,与既往临床研究结果大致相符。目前,关于NAs经治的CHB患者发生LLV的机制尚未完全明确,可能的机制有:(1)NAs药物竞争性抑制的局限性;(2)宿主免疫功能较弱或未恢复;(3)部分患者肝细胞处于增殖不活跃状态[15]。
ALT水平可反应宿主免疫状态,在宿主对感染肝细胞的免疫清除过程中,ALT随着免疫反应的增强而逐渐升高,因此高水平的ALT是宿主免疫活跃的标志。有文献[16]报道,NAs治疗的CHB患者ALT在正常范围内或处于低水平可能与LLV的发生相关。另有研究[17]发现,ALT>2倍正常值上限(ULN)的CHB患者经NAs治疗后HBV DNA下降的比例高于ALT在1.3~2×ULN的患者。本研究结果显示,达到SVR的患者在接受NAs抗病毒治疗时的ALT水平>2×ULN,明显高于发生LLV的患者,说明接受抗病毒治疗时高水平的ALT是发生LLV的保护性因素(OR=0.965,95%CI: 0.937~0.994, P=0.018)。因此,基线高ALT的CHB患者接受抗病毒治疗后可能会获得更好的病毒学应答效果。
HBV DNA可直接反映CHB患者体内病毒复制水平,在患者治疗和随访过程中具有非常重要的作用。一项纳入875例CHB患者的研究[9]结果显示基线HBV DNA水平与LLV相关。Zhang等[18]研究发现基线高水平HBV DNA(>6 lgIU/L)时LLV发生率明显高于基线HBV DNA≤6 lgIU/L患者。本研究中,LLV组患者基线HBV DNA水平显著高于SVR组,基线HBV DNA是LLV发生独立危险因素。进一步对HBV DNA分析结果发现,当基线HBV DNA>7.29 lgIU/mL时,HBV DNA阴转率会降低,而LLV发生风险将增加8倍以上,提示基线HBV DNA水平越高,发生LLV风险越大。
HBsAg作为HBV感染的重要标志物在临床上广泛应用,HBV感染的不同阶段,HBsAg水平差别甚大。有研究[19]认为HBsAg是以cccDNA模板合成的,可在一定程度上反映HBV的复制情况。本研究对CHB患者的HBsAg与LLV的相关性分析发现,基线高水平HBsAg是LLV发生独立危险因素,HBsAg越高,HBV DNA阴转率会降低,LLV发生风险越高。这与其他研究的结果大致相同[20-21]。
HBeAg作为HBV核心基因的一部分,是HBV复制的重要指标。有研究[22]发现长期ETV经治的CHB患者中LLV患者的阳性率为88.2%,本研究中LLV组患者HBeAg的阳性率达90%,与既往研究大致相符。Kim等[15]研究发现基线HBeAg阳性是长期ETV经治CHB患者发生LLV的独立危险因素,陈贺等[22]研究也得出此结论。本研究结果显示,HBeAg阳性并非CHB患者发生LLV的独立危险因素,与上述文献观点有所不同,考虑与本研究中HBeAg阳性和HBeAg阴性患者的基线ALT水平[127.5(54.0~217.0)U/L vs 111.4(44.3~230.0)U/L] 差异无统计学意义(Z=1.214,P=0.225),两组患者所处的免疫状态有关,其次可能与样本量较少有关。
关于LLV发生预测模型的研究较少,本研究以HBV DNA、HBsAg和ALT构建了LLV发生的预测模型MLLV,结果显示MLLV预测效能最高(AUC=0.931),敏感度、特异度分别为85.00%、93.10%,为LLV的发生提供了简捷、可靠的预测模型,该模型以反映HBV复制及肝脏炎症为基础构建,可较客观呈现CHB患者肝细胞内病毒复制和肝脏损伤情况,对CHB患者抗病毒治疗的预后有一定的参考价值。进一步对CHB患者血清HBV DNA及HBsAg的动态变化分析发现,抗病毒治疗过程中HBV DNA和HBsAg都呈逐渐下降趋势,但发生LLV的患者HBV DNA及HBsAg水平始终高于SVR患者,随着治疗时间的延长,两者下降的速度也逐渐减慢。Lim等[23]研究发现,使用NAs抗病毒治疗过程中,HBsAg动态变化是HBsAg清除的有力预测因子。因此,对CHB患者在抗病毒治疗过程中监测血清HBV DNA及HBsAg的动态变化具有重要的意义。
综述所述,基线HBV DNA、HBsAg和ALT是NAs治疗的CHB患者发生LLV的独立影响因素,以此建构的预测模型可以较准确的预测LLV的发生发展。此外,HBV DNA、HBsAg的动态变化对CHB患者抗病毒治疗具有一定的指导作用。但本研究样本量较少,只构建了预测模型,尚未能进行验证模型验证,下一步将扩大样本量,验证该模型及结论,积极探讨LLV的干预措施,并进一步探究其发生的机制,为LLV患者的管理提供参考。
-
表 1 CHB患者基线临床特征和实验室指标分析
Table 1. Analysis of baseline clinical characteristics and laboratory indexes of CHB patients
项目 所有患者(n=78) SVR组(n=58) LLV组(n=20) 统计值 P值 年龄(岁) 32(29~39) 33(30~43) 29(26~34) Z=-2.751 0.009 男性[例(%)] 54(69.2) 40(68.9) 14(70.0) χ2=0.007 0.931 家族史[例(%)] 22(28.2) 16(27.6) 6(30.0) χ2=0.043 0.836 BMI(kg/m2) 23.3±3.7 23.7±4.0 22.3±2.5 t=1.359 0.164 HBeAg阳性[例(%)] 46(59.0) 28(48.3) 18(90.0) χ2=10.701 0.001 lgHBV DNA(IU/mL) 6.07±1.78 5.65±1.70 7.26±1.46 t=-4.178 <0.001 lgHBsAg(IU/mL) 3.72±1.02 3.44±0.93 4.53±0.86 t=-4.813 <0.001 抗-HBc 8.50(7.51~9.83) 8.56(7.65~9.80) 8.46(6.91~9.87) Z=-0.092 0.927 AST(U/L) 68.0(38.5~125.5) 77.5(35.0~213.0) 43.5(32.8~62.8) Z=-2.466 0.014 ALT(U/L) 105.0(53.4~218.0) 111.0(47.0~406.0) 67.0(54.0~122.0) Z=-2.203 0.028 TBil(μmol/L) 15.6(10.2~32.5) 17.0(11.2~36.6) 15.0(9.3~20.7) Z=-1.087 0.277 Alb(g/L) 44.5(40.2~46.9) 43.6(38.4~46.5) 46.3(42.7~48.5) Z=2.352 0.073 TG(mmol/L) 1.00(0.63~1.44) 1.03(0.62~1.57) 0.96(0.76~13.20) Z=-0.069 0.945 Cr(μmol/L) 65.6(56.7~76.4) 62.3(54.9~73.5) 68.2(56.1~71.9) Z=2.432 0.065 PLT(×109) 181.7±65.9 174.3±67.3 202.7±58.4 t=-1.769 0.067 LSM(kPa) 8.1(6.8~11.2) 8.9(7.2~11.4) 7.7(6.3~8.5) Z=-2.022 0.043 肝硬化[例(%)] 25(32.1) 20(34.5) 5(25.0) χ2=0.614 0.433 抗病毒药物类型[例(%)] χ2=1.345 0.246 ETV初治 66(84.6) 49(84.5) 17(85.0) TDF或TAF初治 12(15.4) 9(15.5) 3(15.0) MAFLD[例(%)] 17(21.8) 13(22.4) 4(20.0) χ2=0.051 0.822 表 2 MLLV模型的建立
Table 2. Establishment of the MLLV model
变量 B值 SE Wald OR 95%CI P值 lgHBV DNA 0.589 0.245 5.932 1.818 1.124~2.942 0.015 lgHBsAg 1.441 0.586 6.051 4.225 1.340~13.316 0.014 ALT -0.016 0.007 4.918 0.984 0.969~0.998 0.027 常数 -8.668 2.355 13.551 0.001 <0.001 表 3 HBV DNA、HBsAg、ALT和MLLV对LLV发生的预测价值
Table 3. Predictive value of HBV DNA, HBsAg, ALT and MLLV for the occurrence of LLV
指标 AUC 95%CI 截断值 敏感度 特异度 P值 HBV DNA 0.774 0.665~0.861 7.29 70.00% 82.76% <0.001 HBsAg 0.856 0.758~0.925 4.38 85.00% 87.93% <0.001 ALT 0.666 0.550~0.769 139.80 95.00% 44.83% 0.007 MLLV 0.931 0.850~0.976 0.44 85.00% 93.10% <0.001 表 4 CHB患者治疗期间HBV DNA和HBsAg动态变化
Table 4. Dynamic changes of HBV DNA level and HBsAg level in CHB patients during treatment
时间 SVR组(n=58) LLV组 (n=20) t值 P值 HBV DNA(lgIU/mL) 基线 5.62±1.69 7.35±1.44 -4.084 <0.001 12周 2.62±1.261) 4.08±1.221) -4.526 <0.001 24周 1.82±0.731) 2.99±0.861) -5.688 <0.001 36周 1.43±0.371) 2.73±0.791) -7.123 <0.001 48周 1.28±0.341) 2.19±0.651) -6.266 <0.001 HBsAg(lgIU/mL) 基线 3.44±0.92 4.53±0.86 -4.652 <0.001 12周 3.23±0.801) 4.22±0.871) -4.691 <0.001 24周 3.16±0.701) 4.11±0.831) -4.952 <0.001 36周 3.12±0.661) 3.98±0.771) -4.804 <0.001 48周 3.00±0.691) 3.81±0.771) -4.407 <0.001 注:与同组基线比较,1)P<0.05。 -
[1] HUTIN Y, NASRULLAH M, EASTERBROOK P, et al. Access to treatment for hepatitis B virus infection-worldwide, 2016[J]. MMWR Morb Mortal Wkly Rep, 2018, 67(28): 773-777. DOI: 10.15585/mmwr.mm6728a2. [2] Polaris Observatory Collaborators. Global prevalence, treatment, and prevention of hepatitis B virus infection in 2016: a modelling study[J]. Lancet Gastroenterol Hepatol, 2018, 3(6): 383-403. DOI: 10.1016/S2468-1253(18)30056-6. [3] Chinese Society of Infectious Disease, Chinese Society of Hepatology, Chinese Medical Association. The expert consensus on clinical cure (functional cure) of chronic hepatitis B[J]. J Clin Hepatol, 2019, 35(8): 1693-1701. DOI: 10.3969/j.issn.1001-5256.2019.08.008.中华医学会感染病学分会, 中华医学会肝病学分会. 慢性乙型肝炎临床治愈(功能性治愈)专家共识[J]. 临床肝胆病杂志, 2019, 35(8): 1693-1701. DOI: 10.3969/j.issn.1001-5256.2019.08.008. [4] KIM HJ, CHO YK, JEON WK, et al. Clinical characteristics of patients with chronic hepatitis B who developed genotypic resistance to entecavir: Real-life experience[J]. Clin Mol Hepatol, 2017, 23(4): 323-330. DOI: 10.3350/cmh.2017.0005. [5] SHIN SK, YIM HJ, KIM JH, et al. Partial virological response after 2 years of entecavir therapy increases the risk of hepatocellular carcinoma in patients with hepatitis B virus-associated cirrhosis[J]. Gut Liver, 2021, 15(3): 430-439. DOI: 10.5009/gnl20074. [6] SUN Y, WU X, ZHOU J, et al. Persistent low level of hepatitis B virus promotes fibrosis progression during therapy[J]. Clin Gastroenterol Hepatol, 2020, 18(11): 2582-2591. e6. DOI: 10.1016/j.cgh.2020.03.001. [7] MAK LY, HUANG Q, WONG DK, et al. Residual HBV DNA and pgRNA viraemia is associated with hepatocellular carcinoma in chronic hepatitis B patients on antiviral therapy[J]. J Gastroenterol, 2021, 56(5): 479-488. DOI: 10.1007/s00535-021-01780-5. [8] Chinese Society of Infectious Diseases, Chinese Medical Association, Chinese Society of Hepatology, Chinese Medical Association. Guidelines for the prevention and treatment of chronic hepatitis B (version 2019)[J]. J Clin Hepatol, 2019, 35(12): 2648-2669. DOI: 10.3969/j.issn.1001-5256.2019.12.007.中华医学会感染病学分会, 中华医学会肝病学分会. 慢性乙型肝炎防治指南(2019年版)[J]. 临床肝胆病杂志, 2019, 35(12): 2648-2669. DOI: 10.3969/j.issn.1001-5256.2019.12.007. [9] LU FM, FENG B, ZHENG SJ, et al. Current status of the research on low-level viremia in chronic hepatitis B patients receiving nucleos(t)ide analogues[J]. J Clin Hepatol, 2021, 37(6): 1268-1274. DOI: 10.3969/j.issn.1001-5256.2021.06.007.鲁凤民, 封波, 郑素军, 等. 核苷(酸)类似物经治的慢性乙型肝炎患者低病毒血症的研究现状[J]. 临床肝胆病杂志, 2021, 37(6): 1268-1274. DOI: 10.3969/j.issn.1001-5256.2021.06.007. [10] SHEN JY, HE R, DENG HM, et al. Clinical efficacy of tenofovir in the treatment of chronic hepatitis B[J]. Int J Virol, 2021, 28(2): 154-157. DOI: 10.3760/cma.j.issn.1673-4092.2021.02.015.沈金勇, 何然, 邓红梅, 等. 替诺福韦治疗慢性乙型肝炎患者临床疗效分析[J]. 国际病毒学杂志, 2021, 28(2): 154-157. DOI: 10.3760/cma.j.issn.1673-4092.2021.02.015. [11] LI H, XU WT, DENG BC, et al. Research progress in the functional treatment of chronic hepatitis B with nucleoside (acid) analogues and pegylated interferon[J]. Clin J Med Offic, 2022, 50(9): 890-893. DOI: 10.16680/j.1671-3826.2022.09.04.李卉, 许文涛, 邓宝成, 等. 核苷(酸)类似物联合聚乙二醇干扰素功能性治愈慢性乙型肝炎研究进展[J]. 临床军医杂志, 2022, 50(9): 890-893. DOI: 10.16680/j.1671-3826.2022.09.04. [12] OGAWA E, NOMURA H, NAKAMUTA M, et al. Tenofovir alafenamide after switching from entecavir or nucleos(t)ide combination therapy for patients with chronic hepatitis B[J]. Liver Int, 2020, 40(7): 1578-1589. DOI: 10.1111/liv.14482. [13] AGARWAL K, BRUNETTO M, SETO WK, et al. 96 weeks treatment of tenofovir alafenamide vs. tenofovir disoproxil fumarate for hepatitis B virus infection[J]. J Hepatol, 2018, 68(4): 672-681. DOI: 10.1016/j.jhep.2017.11.039. [14] LEE SB, JEONG J, PARK JH, et al. Low-level viremia and cirrhotic complications in patients with chronic hepatitis B according to adherence to entecavir[J]. Clin Mol Hepatol, 2020, 26(3): 364-375. DOI: 10.3350/cmh.2020.0012. [15] KIM JH, SINN DH, KANG W, et al. Low-level viremia and the increased risk of hepatocellular carcinoma in patients receiving entecavir treatment[J]. Hepatology, 2017, 66(2): 335-343. DOI: 10.1002/hep.28916. [16] REVILL PA, CHISARI FV, BLOCK JM, et al. A global scientific strategy to cure hepatitis B[J]. Lancet Gastroenterol Hepatol, 2019, 4(7): 545-558. DOI: 10.1016/S2468-1253(19)30119-0. [17] WU IC, LAI CL, HAN SH, et al. Efficacy of entecavir in chronic hepatitis B patients with mildly elevated alanine aminotransferase and biopsy-proven histological damage[J]. Hepatology, 2010, 51(4): 1185-1189. DOI: 10.1002/hep.23424. [18] ZHANG Q, PENG H, LIU X, et al. Chronic hepatitis B infection with low level viremia correlates with the progression of the liver disease[J]. J Clin Transl Hepatol, 2021, 9(6): 850-859. DOI: 10.14218/JCTH.2021.00046. [19] BAO T, HU QG, YE J, et al. Value of HBsAg level in dynamic monitoring of disease progression in patients with chronic HBV infection[J]. J Clin Hepatol, 2017, 33(8): 1475-1478. DOI: 10.3969/j.issn.1001-5256.2017.08.012.鲍腾, 胡庆刚, 叶珺, 等. HBsAg水平在慢性HBV感染者疾病进展中的动态监测价值[J]. 临床肝胆病杂志, 2017, 33(8): 1475-1478. DOI: 10.3969/j.issn.1001-5256.2017.08.012. [20] SONG JC, MIN BY, KIM JW, et al. Pretreatment serum HBsAg-to-HBV DNA ratio predicts a virologic response to entecavir in chronic hepatitis B[J]. Korean J Hepatol, 2011, 17(4): 268-273. DOI: 10.3350/kjhep.2011.17.4.268. [21] LEE JM, AHN SH, KIM HS, et al. Quantitative hepatitis B surface antigen and hepatitis B e antigen titers in prediction of treatment response to entecavir[J]. Hepatology, 2011, 53(5): 1486-1493. DOI: 10.1002/hep.24221. [22] CHEN H, FU JJ, LI L, et al. Influencing factors for low-level viremia in chronic hepatitis B patients treated with long-term entecavir antiviral therapy[J]. J Clin Hepatol, 2021, 37(3): 556-559. DOI: 10.3969/j.issn.1001-5256.2021.03.011.陈贺, 傅涓涓, 李丽, 等. 长期恩替卡韦经治慢性乙型肝炎患者低病毒血症的相关影响因素[J]. 临床肝胆病杂志, 2021, 37(3): 556-559. DOI: 10.3969/j.issn.1001-5256.2021.03.011. [23] LIM SG, PHYO WW, LING J, et al. Comparative biomarkers for HBsAg loss with antiviral therapy shows dominant influence of quantitative HBsAg (qHBsAg)[J]. Aliment Pharmacol Ther, 2021, 53(1): 172-182. DOI: 10.1111/apt.16149. 期刊类型引用(10)
1. 孔宁. 慢性乙型病毒性肝炎患者经恩替卡韦治疗后发生低病毒血症的影响因素. 中国民康医学. 2025(04): 16-19 .  百度学术
百度学术2. 张祥运,马序竹,于国英. 慢性乙型肝炎患者低病毒血症影响因素及管理策略研究. 肝脏. 2024(02): 247-250 .  百度学术
百度学术3. 陶学萍,李丽娇,漆阳红,邓勇,欧书强. 慢性乙型肝炎低病毒血症患者转阴的影响因素与治疗策略探讨. 中国医学创新. 2024(15): 162-166 .  百度学术
百度学术4. 谢露,刘亚楠,刘光伟,李鹏宇,胡新宁,康秋佳,郭会军. 经治慢性乙型肝炎患者低病毒血症发生率和影响因素的Meta分析. 临床肝胆病杂志. 2024(07): 1334-1342 .  本站查看
本站查看5. 戴林君. 富马酸替诺福韦联合恩替卡韦治疗慢性乙型病毒性肝炎患者低病毒血症的效果. 医药前沿. 2024(01): 37-39 .  百度学术
百度学术6. 安国兴. 慢性乙型肝炎经恩替卡韦治疗后发生低病毒血症的影响因素分析. 医药前沿. 2024(21): 25-27 .  百度学术
百度学术7. 张沙沙,赵迎春,周红霞. 恩替卡韦经治乙肝肝硬化患者低病毒血症对肝癌发病的影响. 临床荟萃. 2024(11): 980-983 .  百度学术
百度学术8. 张丹,丁洋. 慢性乙型肝炎患者病毒载量与疾病状态和治疗策略选择. 实用肝脏病杂志. 2023(05): 612-614 .  百度学术
百度学术9. 吕承秀,陈梅,王纪传,李庆,张琨婷,孙晓琳. 慢性乙型肝炎患者接受核苷(酸)类似物治疗后发生低病毒血症的危险因素及机制研究. 现代检验医学杂志. 2023(05): 133-137+184 .  百度学术
百度学术10. 陶学萍,李丽娇,漆阳红,欧书强,邓勇,李根,邱艳. 提高HBV DNA灵敏度检测对慢性乙型肝炎低病毒血症的临床价值. 中国医药指南. 2023(33): 1-4 .  百度学术
百度学术其他类型引用(1)
-


 PDF下载 ( 2326 KB)

 下载:
下载:


 下载:
下载:


 百度学术
百度学术


