PDF下载 ( 1893 KB)

甘油三酯葡萄糖乘积指数联合肥胖指标对阻塞性睡眠呼吸暂停患者发生非酒精性脂肪性肝病的预测价值
DOI: 10.3969/j.issn.1001-5256.2023.03.010
Value of triglyceride-glucose index combined with obesity index in predicting nonalcoholic fatty liver disease in individuals with obstructive sleep apnea
-
摘要:
目的 探讨甘油三酯葡萄糖乘积指数(TyG)、TyG联合BMI及TyG联合腰围(WC)预测阻塞性睡眠呼吸暂停(OSA)患者发生非酒精性脂肪性肝病(NAFLD)的价值。 方法 回顾性分析2020年1月—2021年12月在昆明医科大学第二附属医院行睡眠呼吸监测并诊断为OSA的患者190例,依据超声检查结果分为OSA合并NAFLD组107例及对照组83例。计量资料两组间比较采用t检验或Mann-Whitney U检验;计数资料两组间比较采用χ2检验。采用二元Logistic回归分析探讨OSA患者发生NAFLD的影响因素。绘制TyG、TyG联合BMI及TyG联合WC预测OSA患者发生NAFLD的受试者工作特征曲线(ROC曲线),计算曲线下面积(AUC)。AUC的比较采用Z检验。 结果 与对照组相比,OSA合并NAFLD患者的BMI、颈围、WC、AHI、ODI、ALT、GGT、TG、FPG、TyG较高,年龄、Average SpO2、LSaO2、HDL-C较低(P值均<0.05)。二元Logistic分析显示TyG(OR=1.961,95%CI:1.03~3.73,P=0.040)、BMI(OR=1.203,95%CI:1.03~1.41,P=0.020)、WC(OR=1.074,95%CI:1.01~1.14,P=0.026)为OSA患者发生NAFLD的独立危险因素。TyG、TyG联合BMI及TyG联合WC预测OSA患者发生NAFLD的AUC(95%CI)分别为0.696(0.625~0.760)、0.787(0.722~0.843)和0.803(0.739~0.857),最佳截断点分别为8.72、0.36和0.60。TyG联合BMI对OSA患者发生NAFLD的预测价值高于TyG(Z=2.542,P=0.011),TyG联合WC的预测价值也高于TyG(Z=2.976,P=0.002 9)。 结论 TyG、TyG联合BMI及TyG联合WC对OSA发生NAFLD具有良好的预测价值,以TyG联合WC的预测价值最佳,有望成为OSA患者发生NAFLD风险的预测指标。 -
关键词:
- 睡眠呼吸暂停, 阻塞性 /
- 非酒精性脂肪性肝病 /
- 甘油三酯葡萄糖乘积指数 /
- 人体质量指数 /
- 腰围
Abstract:Objective To investigate the value of triglyceride-glucose index (TyG), TyG combined with body mass index (BMI), and TyG combined with waist circumference (WC) in predicting nonalcoholic fatty liver disease (NAFLD) in patients with obstructive sleep apnea (OSA). Methods A retrospective analysis was performed for 190 patients who underwent sleep respiratory monitoring and were diagnosed with OSA in The Second Affiliated Hospital of Kunming Medical University from January 2020 to December 2021, and according to the results of ultrasonography, they were divided into OSA+NAFLD group with 107 patients and control group with 83 patients. The t-test or the Mann Whitney U test was used for comparison of continuous data between two groups, and the chi-square test was used for comparison of categorical data between two groups. The binary logistic regression analysis was used to explore the influencing factors for the development of NAFLD in patients with OSA. The receiver operating characteristic (ROC) curve was plotted for TyG, TyG combined with BMI, and TyG combined with WC in predicting NAFLD in the patients with OSA, and the area under the ROC curve (AUC) was calculated. The Z test was used for comparison of AUC. Results Compared with the control group, the OSA+NAFLD group had significantly higher BMI, neck circumference, WC, apnea-hypopnea index, oxygen desaturation index, alanine aminotransferase, gamma-glutamyltransferase, triglyceride, fasting plasma glucose, and TyG and significantly lower age, average SpO2, LSaO2, and high-density lipoprotein cholesterol (all P < 0.05). The binary logistic regression analysis showed that TyG (odds ratio [OR]=1.961, 95% confidence interval [CI]: 1.03-3.73, P=0.04), BMI (OR=1.203, 95%CI: 1.03-1.41, P=0.020), and WC (OR=1.074, 95%CI: 1.01-1.14, P=0.026) were independent risk factors for NAFLD in patients with OSA. TyG, TyG combined with BMI, and TyG combined with WC had an AUC of 0.696 (95%CI: 0.625-0.760), 0.787 (95%CI: 0.722-0.843), and 0.803 (95%CI: 0.739-0.857), respectively, in predicting NAFLD in OSA patients, with an optimal cut-off value of 8.72, 0.36, and 0.60, respectively. TyG combined with BMI had a significantly higher value than TyG in predicting NAFLD in OSA patients (Z=2.542, P=0.011), and TyG combined with WC also had a significantly higher predictive value than TyG (Z=2.976, P=0.002 9). Conclusion TyG, TyG combined with BMI, and TyG combined with WC have a good value in predicting NAFLD in OSA patients, among which TyG combined with WC has the best predictive value and is thus expected to become a predictor for the risk of NAFLD in OSA patients. -
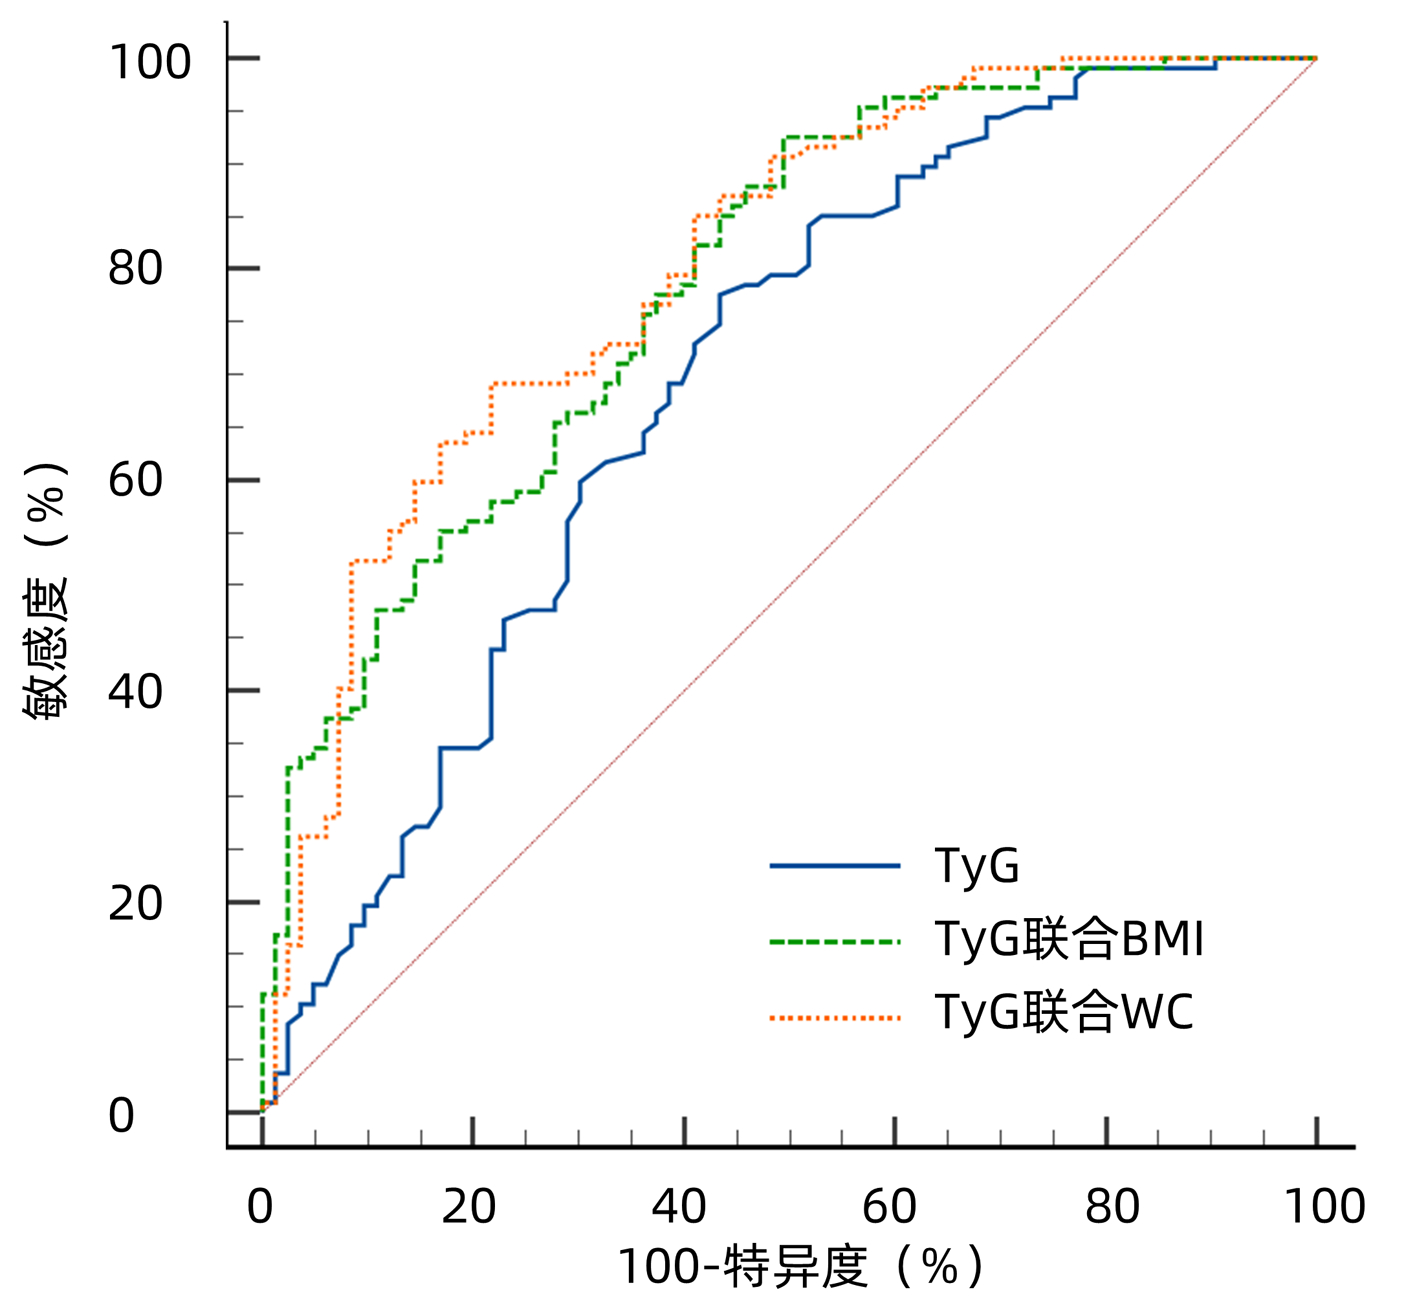
图 1 TyG、TyG联合BMI及TyG联合WC预测OSA患者发生NAFLD的ROC曲线
Figure 1. ROC curve of TyG、TyG combined with BMI and TyG combined with WC for predicting NAFLD in OSA patients
表 1 两组患者临床资料比较
Table 1. Comparison of the clinical characteristics between OSA patients with and without NAFLD
指标 对照组
(n=83)OSA合并NAFLD
(n=107)统计值 P值 男性[例(%)] 48(57.8) 69(64.5) χ2=0.875 0.350 年龄(岁) 58.05±12.99 53.22±13.37 t=2.498 0.013 BMI(kg/m2) 23.94±3.59 27.77±3.63 t=-7.236 <0.001 颈围(cm) 37.00(35.00~40.00) 40.00(37.00~43.00) Z=-4.396 <0.001 WC(cm) 88.00(84.00~96.00) 102.00(93.50~107.00) Z=-6.786 <0.001 AHI(次/h) 32.50(24.60~50.10) 40.60(29.95~64.55) Z=-2.916 0.004 ODI 24.70(13.50~38.30) 37.30(19.00~56.05) Z=-2.977 0.003 LSaO2(%) 79.00(72.00~81.00) 75.00(66.00~79.00) Z=-2.694 0.007 Average SpO2(%) 91.10(88.50~92.30) 89.50(87.60~90.80) Z=-3.567 <0.001 ALT(U/L) 17.00(12.00~25.00) 21.00(17.00~36.50) Z=-3.933 <0.001 AST(U/L) 19.00(16.00~24.00) 20.00(16.00~27.00) Z=-0.703 0.482 ALP(U/L) 78.00(62.00~90.00) 75.00(64.50~91.00) Z=-0.748 0.455 GGT(U/L) 24.00(17.00~39.00) 36.00(26.00~55.00) Z=-4.168 <0.001 TC(mmol/L) 4.17(3.63~5.28) 4.55(3.75~5.23) Z=-1.178 0.239 TG(mmol/L) 1.28(0.90~2.03) 1.84(1.35~2.52) Z=-4.397 <0.001 HDL-C(mmol/L) 1.12(0.91~1.30) 0.97(0.85~1.11) Z=-3.506 <0.001 LDL-C(mmol/L) 2.59(2.25~3.41) 2.89(2.40~3.52) Z=-1.411 0.158 FPG(mmol/L) 4.99(4.56~5.83) 5.59(4.96~6.78) Z=-3.012 0.003 TyG 8.69±0.67 9.13±0.59 t=-4.771 <0.001  下载: 导出CSV
表 2 OSA患者发生NAFLD影响因素的二元logistic回归分析
Table 2. Binary logistic regression analysis of factors influencing the occurrence of NAFLD in OSA patients
指标 Β值 标准误 Wald OR 95%CI P值 年龄(岁) -0.007 0.016 0.164 0.993 0.96~1.03 0.685 BMI(kg/m2) 0.185 0.079 5.455 1.203 1.03~1.41 0.020 颈围(cm) -0.094 0.070 1.801 0.910 0.79~1.04 0.180 WC(cm) 0.071 0.032 4.951 1.074 1.01~1.14 0.026 AHI(次/h) 0.016 0.020 0.630 1.016 0.98~1.06 0.428 ODI 0.003 0.018 0.031 1.003 0.97~1.04 0.860 LSaO2(%) 0.020 0.031 0.407 1.020 0.96~1.08 0.524 Average SpO2(%) 0.064 0.062 1.077 1.066 0.94~1.2 0.299 ALT(U/L) 0.004 0.017 0.055 1.004 0.97~1.04 0.814 GGT(U/L) 0.006 0.008 0.559 1.006 0.99~1.02 0.455 HDL-C(mmol/L) -0.765 0.906 0.713 0.465 0.08~2.75 0.398 TyG 0.674 0.328 4.229 1.961 1.03~3.73 0.040
下载: 导出CSV
表 3 TyG、TyG联合BMI及TyG联合WC对OSA患者发生NAFLD的预测价值
Table 3. Predictive value of TyG, TyG combined with BMI and TyG combined with WC for OSA patients with NAFLD
指标 最佳截断点 AUC
(95%CI)P值 敏感度
(%)特异度
(%)阳性似然比 阴性似然比 约登指数 TyG 8.72 0.696(0.625~0.760) <0.001 77.57 56.63 1.79 0.40 0.3420 TyG联合BMI 0.36 0.787(0.722~0.843) <0.001 92.52 50.60 1.87 0.15 0.4313 TyG联合WC 0.60 0.803(0.739~0.857) <0.001 69.16 78.31 3.19 0.39 0.4747
下载: 导出CSV
-
[1] BENJAFIELD AV, AYAS NT, EASTWOOD PR, et al. Estimation of the global prevalence and burden of obstructive sleep apnoea: a literature-based analysis[J]. Lancet Respir Med, 2019, 7(8): 687-698. DOI: 10.1016/S2213-2600(19)30198-5. [2] YOUNOSSI ZM, KOENIG AB, ABDELATIF D, et al. Global epidemiology of nonalcoholic fatty liver disease-Meta-analytic assessment of prevalence, incidence, and outcomes[J]. Hepatology, 2016, 64(1): 73-84. DOI: 10.1002/hep.28431. [3] UMBRO I, FABIANI V, FABIANI M, et al. Association between non-alcoholic fatty liver disease and obstructive sleep apnea[J]. World J Gastroenterol, 2020, 26(20): 2669-2681. DOI: 10.3748/wjg.v26.i20.2669. [4] KHAN SH, SOBIA F, NIAZI NK, et al. Metabolic clustering of risk factors: evaluation of Triglyceride-glucose index (TyG index) for evaluation of insulin resistance[J]. Diabetol Metab Syndr, 2018, 10: 74. DOI: 10.1186/s13098-018-0376-8. [5] SONG K, LEE HW, CHOI HS, et al. Comparison of the Modified TyG indices and other parameters to predict non-alcoholic fatty liver disease in youth[J]. Biology (Basel), 2022, 11(5): 685. DOI: 10.3390/biology11050685. [6] Sleep Medicine Committee of Chinese Medical Doctor Association. Guidelines for multidisciplinary diagnosis and treatment of adult obstructive sleep apnea[J]. Natl Med J China, 2018, 98(24): 1902-1914. DOI: 10.3760/cma.j.issn.0376-2491.2018.24.003.中国医师协会睡眠医学专业委员会. 成人阻塞性睡眠呼吸暂停多学科诊疗指南[J]. 中华医学杂志, 2018, 98(24): 1902-1914. DOI: 10.3760/cma.j.issn.0376-2491.2018.24.003. [7] National Workshop on Fatty Liver and Alcoholic Liver Disease, Chinese Society of Hepatology, Chinese Medical Association; Fatty Liver Expen Committee, Chinese Medical Doctor Association. Guidelines of prevention and treatment for nonalcoholic fatty liver disease: A 2018 update[J]. J Clin Hepatol, 2018, 34(5): 947-957. DOI: 10.3969/j.issn.1001-5256.2018.05.007.中华医学会肝病学分会脂肪肝和酒精性肝病学组, 中国医师协会脂肪性肝病专家委员会. 非酒精性脂肪性肝病防治指南(2018年更新版)[J]. 临床肝胆病杂志, 2018, 34(5): 947-957. DOI: 10.3969/j.issn.1001-5256.2018.05.007. [8] SIMENTAL-MENDÍA LE, RODRÍGUEZ-MORÁN M, GUERRERO-ROMERO F. The product of fasting glucose and triglycerides as surrogate for identifying insulin resistance in apparently healthy subjects[J]. Metab Syndr Relat Disord, 2008, 6(4): 299-304. DOI: 10.1089/met.2008.0034. [9] DELONG ER, DELONG DM, CLARKE-PEARSON DL. Comparing the areas under two or more correlated receiver operating characteristic curves: a nonparametric approach[J]. Biometrics, 1988, 44(3): 837-845. [10] MESARWI OA, LOOMBA R, MALHOTRA A. Obstructive sleep apnea, hypoxia, and nonalcoholic fatty liver disease[J]. Am J Respir Crit Care Med, 2019, 199(7): 830-841. DOI: 10.1164/rccm.201806-1109TR. [11] JIN S, JIANG S, HU A. Association between obstructive sleep apnea and non-alcoholic fatty liver disease: a systematic review and meta-analysis[J]. Sleep Breath, 2018, 22(3): 841-851. DOI: 10.1007/s11325-018-1625-7. [12] CHEN LD, ZHANG LJ, LIN XJ, et al. Association between continuous positive airway pressure and serum aminotransferases in patients with obstructive sleep apnea[J]. Eur Arch Otorhinolaryngol, 2018, 275(2): 587-594. DOI: 10.1007/s00405-017-4840-0. [13] CAKMAK E, DUKSAL F, ALTINKAYA E, et al. Association between the severity of nocturnal hypoxia in obstructive sleep apnea and non-alcoholic fatty liver damage[J]. Hepat Mon, 2015, 15(11): e32655. DOI: 10.5812/hepatmon.32655. [14] LIU YR, WEN XH, GAO M, et al. Correlation between atherogenic index of plasma and nonalcoholic fatty liver disease in non-obese populations[J]. Clin Misdiagn Misther, 2021, 34(10): 100-104. DOI: 10.3969/j.issn.1002-3429.2021.10.021.刘艳如, 温晓华, 高冕, 等. 非肥胖人群血浆致动脉硬化指数与非酒精性脂肪性肝病的相关性[J]. 临床误诊误治, 2021, 34(10): 100-104. DOI: 10.3969/j.issn.1002-3429.2021.10.021. [15] BETTINI S, SERRA R, FABRIS R, et al. Association of obstructive sleep apnea with non-alcoholic fatty liver disease in patients with obesity: an observational study[J]. Eat Weight Disord, 2021, 27(1): 335-343. DOI: 10.1007/s40519-021-01182-9. [16] FU YM, WANG CY, LI ZB, et al. Diagnostic efficiency of controlled attenuation parameter on hepatic steatosis of patients with nonalcoholic fatty liver disease[J]. Med J Chin PLA, 2022, 47(6): 593-598. DOI: 10.11855/j.issn.0577-7402.2022.06.0593.付懿铭, 王春艳, 李忠斌, 等. 受控衰减参数对非酒精性脂肪性肝病患者肝脂肪变性分级的诊断价值[J]. 解放军医学杂志, 2022, 47(6): 593-598. DOI: 10.11855/j.issn.0577-7402.2022.06.0593. [17] STAREKOVA J, HERNANDO D, PICKHARDT PJ, et al. Quantification of liver fat content with CT and MRI: State of the art[J]. Radiology, 2021, 301(2): 250-262. DOI: 10.1148/radiol.2021204288. [18] ER LK, WU S, CHOU HH, et al. Triglyceride glucose-body mass index is a simple and clinically useful surrogate marker for insulin resistance in nondiabetic individuals[J]. PLoS One, 2016, 11(3): e0149731. DOI: 10.1371/journal.pone.0149731. [19] LEE SB, KIM MK, KANG S, et al. Triglyceride glucose index is superior to the homeostasis model assessment of insulin resistance for predicting nonalcoholic fatty liver disease in Korean adults[J]. Endocrinol Metab (Seoul), 2019, 34(2): 179-186. DOI: 10.3803/EnM.2019.34.2.179. [20] KIM HS, CHO YK, KIM EH, et al. Triglyceride glucose-waist circumference is superior to the homeostasis model assessment of insulin resistance in identifying nonalcoholic fatty liver disease in healthy subjects[J]. J Clin Med, 2021, 11(1): 41. DOI: 10.3390/jcm11010041. [21] KHAMSEH ME, MALEK M, ABBASI R, et al. Triglyceride glucose index and related parameters (triglyceride glucose-body mass index and triglyceride glucose-waist circumference) identify nonalcoholic fatty liver and liver fibrosis in individuals with overweight/obesity[J]. Metab Syndr Relat Disord, 2021, 19(3): 167-173. DOI: 10.1089/met.2020.0109. [22] FERRAIOLI G, SOARES MONTEIRO LB. Ultrasound-based techniques for the diagnosis of liver steatosis[J]. World J Gastroenterol, 2019, 25(40): 6053-6062. DOI: 10.3748/wjg.v25.i40.6053. 期刊类型引用(1)
1. 孙巍,丁晓燕,陈京龙,李文东,郭晓笛,申燕军,滕颖,刘晓民,魏建莹. MicroRNA-520a通过失活AKT抑制HepG2.2.15细胞中HBV DNA复制. 中国肝脏病杂志(电子版). 2018(04): 73-78 .  百度学术
百度学术其他类型引用(0)
-

 百度学术
百度学术